Trading the gold market
As the price of gold rises ever higher, the gold market is displaying some very strange behaviour. John C Burford looks at the charts to find out why.
Get the latest financial news, insights and expert analysis from our award-winning MoneyWeek team, to help you understand what really matters when it comes to your finances.
You are now subscribed
Your newsletter sign-up was successful
Want to add more newsletters?

Twice daily
MoneyWeek
Get the latest financial news, insights and expert analysis from our award-winning MoneyWeek team, to help you understand what really matters when it comes to your finances.

Four times a week
Look After My Bills
Sign up to our free money-saving newsletter, filled with the latest news and expert advice to help you find the best tips and deals for managing your bills. Start saving today!
Something very strange has been happening in the gold market of late.
Last Friday, I noted the Commitments of Traders (COT) report had shown that the hedge funds, who dominate the market, had piled into gold.
This was one clue (among others) that the gold market had very likely made a top at $1,814 an ounce on Wednesday.
MoneyWeek
Subscribe to MoneyWeek today and get your first six magazine issues absolutely FREE

Sign up to Money Morning
Don't miss the latest investment and personal finances news, market analysis, plus money-saving tips with our free twice-daily newsletter
Don't miss the latest investment and personal finances news, market analysis, plus money-saving tips with our free twice-daily newsletter
But with the latest COT report, which covers the futures holdings as of 9 August, a seismic change has taken place:
| Hedge funds | 259,000 | 55,000 |
| Change in past wk | (-32,000, -11%) | (+11,000, 25%) |
| Small traders (us!) | 73,000 | 27,000 |
| Change on wk | (+6,000) | (+1,000) |
That is some swing!
To summarise, during the week of 2-9 August, the once very bullish hedge funds had sold 6% of the open contracts, and increased by 25% their short positions. Incidentally, small traders had become even more bullish.
The hedgies were obviously getting much more bearish as the price was making new highs. This is precisely the correct stance.
I have written before of how most small traders do the exact opposite, as here and pay the price.
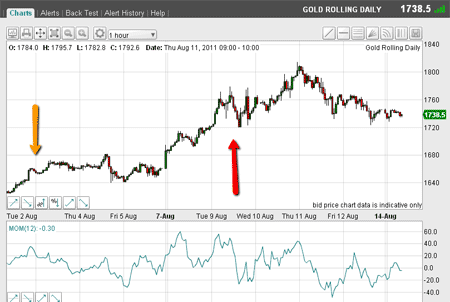
But look at what the chart was saying during that week:

(Click on the chart for a larger version)
I have marked 2 August with a yellow arrow, and 9 August with a red arrow.
While the hedgies were frantically selling, the price rose, and continued rising into the $1,814 top on 11 August!
I have no rational explanation for this. But it does strongly suggest that COT data is of little use for timing trades! I will have to wait a week to get the data for 16 August.
Where is the market sitting now?
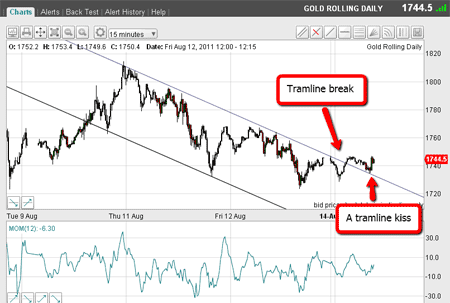
From the Wednesday high, I have enough data points on a short-term chart to set some tramlines. This is always my first task when a significant high has been made.
Trading Tip: After a long run (bull or bear), see if you can find any tramlines using the highs and lows during the pull-back.

(Click on the chart for a larger version)
From the $1,814 high, I can draw my upper tramline, catching most of the important highs on its way down. Then, my lower tramline was easy to set it catches the two important spike lows.
Trading from the $1,814 high has been orderly in the channel between the tramlines. But this morning, there has been an upward break, then a typical pull-back to kiss the line, and the market has moved up away from the line in a scalded cat bounce'.
Let's take a look at the Fibonacci levels on this bounce:

(Click on the chart for a larger version)
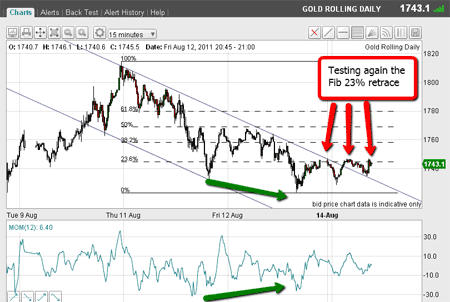
Using the $1,814 high and Friday's $1,723 low as pivots, you can see how the Fibonacci 23.6% level is providing strong resistance.
Trading Tip: Note if important Fibonacci levels have turned the market back before. If so, that means there is powerful resistance there. Shorting at these levels usually represents a good low-risk entry point (because you can set close stops).
Some traders will be shorting here and setting double stops to reverse positions in case the market moves above the Fibonacci 23% level. They would then be long and looking for many buy-stops to propel the market sharply higher.
But look at the negative momentum divergence at the $1,723 low a give-away for an impending rally! This is marked by the green arrows. (You can see that while the price has made a lower low, momentum has not, signalling that selling pressure is drying up).
How high is the current rally likely to go?
OK, so the current rally is not unexpected. The question is: How high is it likely to carry?

(Click on the chart for a larger version)
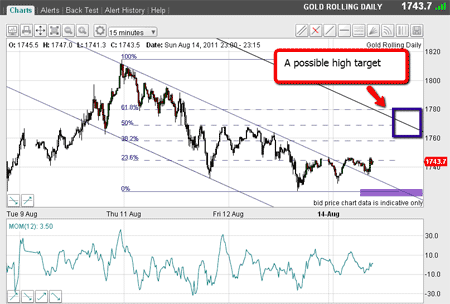
I have drawn a third tramline equidistant from the upper one.
If the market can move decisively up through the 23% level, my highest target will be the meeting of the Fibonacci 50% level and the upper tramline in the $1,770 area.
But first, the market must negotiate the Fibonacci 38% level at the $1,760 area. That would be my initial target and I will be watching very carefully if the market decides to get there.
But if the market moves down from the current level and breaks first my centre tramline, and then the $1,723 low, that will be very bearish.
That would confirm to me that the $1,812 high is a tradable top.
On retracements, I always look for a good A-B-C pattern.
Then, I like to short at wave C. As of now, we have waves A and B will we see a wave C develop?
These are certainly interesting times in the gold market.
Don't miss my next trading insight. To receive all my spread betting blog posts by email, as soon as I've written them, just sign up here .
Get the latest financial news, insights and expert analysis from our award-winning MoneyWeek team, to help you understand what really matters when it comes to your finances.
John is is a British-born lapsed PhD physicist, who previously worked for Nasa on the Mars exploration team. He is a former commodity trading advisor with the US Commodities Futures Trading Commission, and worked in a boutique futures house in California in the 1980s.
He was a partner in one of the first futures newsletter advisory services, based in Washington DC, specialising in pork bellies and currencies. John is primarily a chart-reading trader, having cut his trading teeth in the days before PCs.
As well as his work in the financial world, he has launched, run and sold several 'real' businesses producing 'real' products.
-
 Average UK house price reaches £300,000 for first time, Halifax says
While the average house price has topped £300k, regional disparities still remain, Halifax finds.
-
 Barings Emerging Europe trust bounces back from Russia woes
Barings Emerging Europe trust has added the Middle East and Africa to its mandate, delivering a strong recovery, says Max King