Another Dow short could be on the way
After its recent fall, the Dow Jones is finding support. But can that continue? John C Burford hunts through the charts to find possible turning points for a short trade.
Get the latest financial news, insights and expert analysis from our award-winning MoneyWeek team, to help you understand what really matters when it comes to your finances.
You are now subscribed
Your newsletter sign-up was successful
Want to add more newsletters?

Twice daily
MoneyWeek
Get the latest financial news, insights and expert analysis from our award-winning MoneyWeek team, to help you understand what really matters when it comes to your finances.

Four times a week
Look After My Bills
Sign up to our free money-saving newsletter, filled with the latest news and expert advice to help you find the best tips and deals for managing your bills. Start saving today!
Right on cue, the Dow fell hard following my article on Monday, and is currently finding support on two important tramlines.
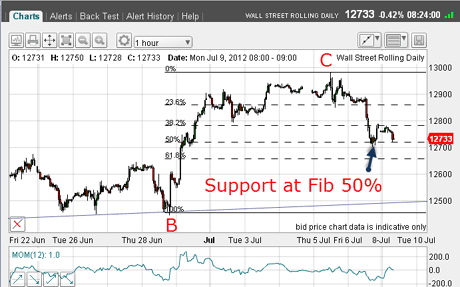
On Monday, this is what the chart revealed:

(Click on the chart for a larger version)
MoneyWeek
Subscribe to MoneyWeek today and get your first six magazine issues absolutely FREE

Sign up to Money Morning
Don't miss the latest investment and personal finances news, market analysis, plus money-saving tips with our free twice-daily newsletter
Don't miss the latest investment and personal finances news, market analysis, plus money-saving tips with our free twice-daily newsletter
From the C wave high at 12,980, the market broke my short-term tramline to give me a short entry at the 12,900 area. The market found a little support at the Fibonacci 50% retrace of the C wave. This is typical behaviour.
Trader tip: When I believe I am in a C wave a final counter-trend wave I apply my Fibonacci tool to the entire wave. That gives reliable targets for the pauses along the way. From these bounces, new short trades can be entered.
But the risk levels on these trades are usually higher than on the original (higher) entry, which is based on a tramline break, since I do not have a method for estimating how high the bounce will carry.
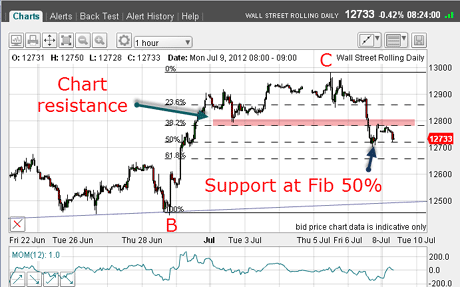
But one aid in minimising your risk is to look for possible chart resistance levels. For example in the chart below, there is one such level (pink bar):

(Click on the chart for a larger version)
The low on 2 July acts as resistance.
This enables you to fine-tune your entry, if you missed the first one.
This was a textbook trade
OK, since Monday, the market has declined nicely towards my targets. So the question is: Where are the likely bounces along the way and are they likely to be large?
For short-term trading, I need to identify likely turning points as close to the low as possible.
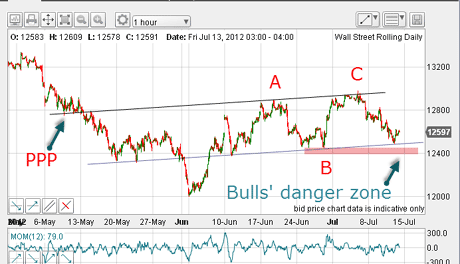
At these junctures, I like to back up and see where the latest action fits into the bigger picture, so here is the hourly chart:

(Click on the chart for a larger version)
As the market was fading off the C wave high this week, I could draw in a terrific tramline pair.
The lower one passes through the major lows since May (except for the early June period) there are at least six great touch-points.
Then, my upper tramline practically drew itself, catching the A and C wave tops and the superb prior pivot point (PPP).
This is textbook stuff so far.
So when the market dropped down yesterday to touch the tramline, that was the point I chose to take short-term profits for a great 400 pip profit, or £400 per £1 bet. Remember, my risk on entry was only 3%, or 80 pips, giving a reward/risk ratio of 5:1. Very satisfactory.
These are the kinds of trades anyone can make to build up a big trading account over time.
As I show in my workshops, by patiently selecting these high reward/risk trades, a trader can anticipate seeing their account grow by roughly 25% per quarter, even allowing for losing trades along the way. Compound this growth over a few years, and I'm sure you can do the maths!
Where is the next turning point?
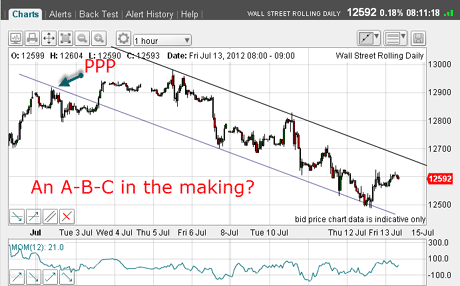
Now this morning, the market is staging a bounce, as I expected, so let's go back to the short-term chart to give clues as to likely turning points. Here is the hourly chart of the decline off the C wave high:

(Click on the chart for a larger version)
Again, I have a terrific tramline pair with great touch-points and a PPP.
The rally off yesterday's touch of the long-term tramline (and this short-term one!) seems to be in the throes of making an A-B-Ccorrective rally. The maximum extent of the rally is the upper tramline to enable me to retain my immediately bearish view but note the three-wave pattern to the decline, so far.
The rally has carried to the Fibonacci 23% retrace of the move down from the C wave top. If this level holds, that would rank as a shallow relief rally a bearish sign.
The market would then probably quickly challenge yesterday's low and go for a break of the long-term tramline, heading for my 12,400 first target (see Monday's article).
But a sharp breaking rally above the upper tramline would cause me to run back to the drawing board, since that would indicate something else is going on.
But as I see it this morning, the odds favour containment by these tramlines.
If you're a new reader, or need a reminder about some of the methods I refer to in my trades, then do have a look at my introductory videos:
The essentials of tramline trading
An introduction to Elliott wave theory
Advanced trading with Elliott waves
Don't miss my next trading insight. To receive all my spread betting blog posts by email, as soon as I've written them, just sign up here .
Get the latest financial news, insights and expert analysis from our award-winning MoneyWeek team, to help you understand what really matters when it comes to your finances.
John is is a British-born lapsed PhD physicist, who previously worked for Nasa on the Mars exploration team. He is a former commodity trading advisor with the US Commodities Futures Trading Commission, and worked in a boutique futures house in California in the 1980s.
He was a partner in one of the first futures newsletter advisory services, based in Washington DC, specialising in pork bellies and currencies. John is primarily a chart-reading trader, having cut his trading teeth in the days before PCs.
As well as his work in the financial world, he has launched, run and sold several 'real' businesses producing 'real' products.
-
 Average UK house price reaches £300,000 for first time, Halifax says
While the average house price has topped £300k, regional disparities still remain, Halifax finds.
-
 Barings Emerging Europe trust bounces back from Russia woes
Barings Emerging Europe trust has added the Middle East and Africa to its mandate, delivering a strong recovery, says Max King