Anatomy of a failed trade
To illustrate the proper use of his money management rules, John C Burford walks through a recent gold trade that failed.
Get the latest financial news, insights and expert analysis from our award-winning MoneyWeek team, to help you understand what really matters when it comes to your finances.
You are now subscribed
Your newsletter sign-up was successful
Want to add more newsletters?

Twice daily
MoneyWeek
Get the latest financial news, insights and expert analysis from our award-winning MoneyWeek team, to help you understand what really matters when it comes to your finances.

Four times a week
Look After My Bills
Sign up to our free money-saving newsletter, filled with the latest news and expert advice to help you find the best tips and deals for managing your bills. Start saving today!
On Friday, I left you with an exercise to find a possible gold trade and I hinted you should look for tramlines operating. This is always my starting point when I look at a chart.
If I can also find appropriate Fibonacci levels and possibly authentic Elliott wave labels, then I probably have a great trade on my hands.
Today, I will give my interpretation of a gold trade that actually failed, but illustrates proper use of my money management rules. But it is not pretty.
MoneyWeek
Subscribe to MoneyWeek today and get your first six magazine issues absolutely FREE

Sign up to Money Morning
Don't miss the latest investment and personal finances news, market analysis, plus money-saving tips with our free twice-daily newsletter
Don't miss the latest investment and personal finances news, market analysis, plus money-saving tips with our free twice-daily newsletter
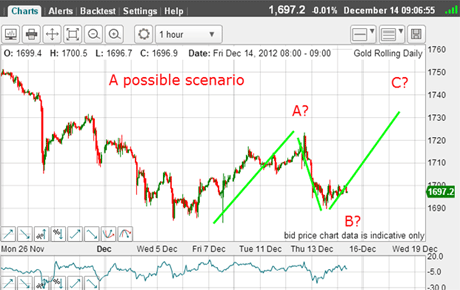
OK, this was the picture on Friday morning:
(Click on the chart for a larger image)
I noted the A-B-C pattern in the wave leading up to the A? label, so this was a possible top before the market resumed its decline.
But I had an equally valid forecast that said we could see a higher wave C? top in the $1,730 region.
It was then that I posed the question: If bearish, where would you enter a low-risk trade?
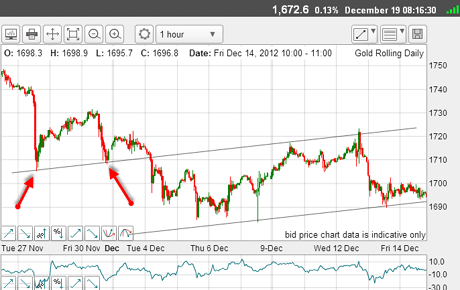
By the close on Friday, this was the scene:
(Click on the chart for a larger image)
And right away, with the superb prior pivot points (PPPs) (red arrows), there is a very solid upper tramline. The lower tramline was similarly easy to draw, as it contained the two lows.
So the trade was: go long near the lower tramline with a protective stop just under the line in the $1,685 $1,690 area. That would give you a low-risk trade of less than 100 pips.
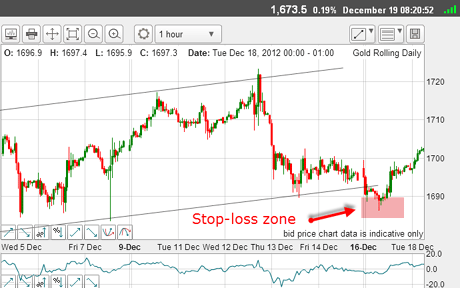
But on Monday, the market broke below my tramline:
(Click on the chart for a larger image)
Of course, if without a position at that point, you would be tempted to take a short trade on the tramline break.
But if you were long, you may or may not be stopped out on the move down to the low of $1,686.3, depending on where you had your stop.
Beware the spiky gold market
This is a vivid illustration of the spikiness of gold. The market gave a false breakout and embarked on a rally back between the tramlines, thus trapping the short trade. Meanwhile, the long trade was similarly stopped out on the false breakout. Ouch.
Trading is not an exact science, and neither is stop-loss placement! In this case, if you had either the original long trade or the short trade working, both trades would have been losers!
But this false breakout is a signal that all is not right with the bear case at least in the short-term. So at that point, I was looking for another long trade. What cannot go down must go up, surely?
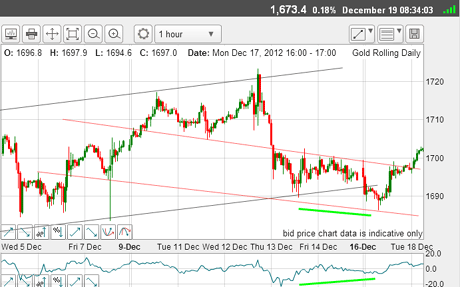
On Monday, I had a closer look at the hourly chart for more clues:
(Click on the chart for a larger image)
Right away, I spotted a good looking down-sloping tramline pair (in red) with Monday's low sporting a nice positive momentum divergence (green bars).
That was enough evidence for me to look for a long trade and my suggested $1,730 upper target then became a distinct possibility.
I was looking at a long trade in the $1,700 area. But where to place my stop?
I reckoned that if this was another false breakout, a move back below my red upper tramline would indicate this. So I gave the trade a 60 pip stop.
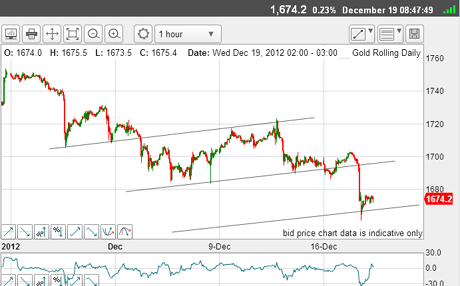
That was a good decision! The market topped yesterday and roared back down below the Monday low:
That was the second false breakout on the trot! And two losing trades. Talk about being whipsawed. This is about the cruellest thing a market can unleash on a trader. Many traders would throw their hands up in disgust but that would be the wrong reaction, and here is why:
As the market came back down under the upper red tramline, it was obvious that my $1,730 target was rapidly receding from view and the market really did want to decline. This action was a clear signal that the budding rally was in trouble.
When the market doesn't behave as it should'
When the market does not behave as it should', then it pays to examine the opposite conclusion. Flexibility is a key quality for swing traders.
So, I had two choices - jump on board the downtrend, or wait for further developments.
(Click on the chart for a larger image)
As it happened, the decline was quick and big. It took the market right down to my third tramline and is currently bouncing around it.
Of course, in hindsight, everything looks obvious doesn't it?
So how does this latest action fit into the bigger picture? Does it give me clues on which side to trade from now on?
(Click on the chart for a larger image)
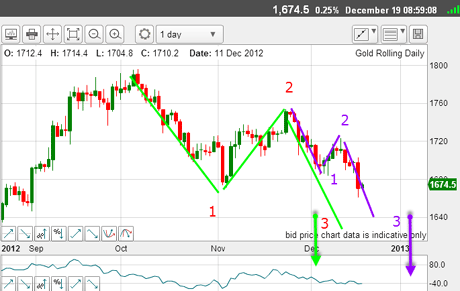
This is the daily chart and shows my Elliott wave labels off the $1,796 top.
The larger waves 1 and 2 (green lines) have given way to the current wave 3. From this wave 2 top at $1,754, I have a smaller wave 1 down and the wave 2 up (purple lines), and am currently in wave 3 down.
This means we are in two third waves of two different degrees. I can say this because with the move yesterday below the November low at $1,670, I can safely disregard the view that there'll be further consolidation.
So Elliott wave theory gives me a clear roadmap for the future - a rapid continuation of the two third waves.
This poses a dilemma. Because asset prices are being supported by changes in liquidity, markets have been joined at the hip for several years. When stocks rally, gold, oil, copper, grains all generally rally.
But lately, US stocks have been moving sharply higher since mid-November, while gold has been in a steep decline. With promises by central banks to expand the money supply (or liquidity), why has gold not responded by moving towards the widely-forecast target of $2,000? It is actually moving away.
The US stock price/gold price ratio, which has been in a steep decline for years, has rallied quite sharply of late. Is this indicating that inflation will finally take off, thereby benefitting equities more than gold?
And with bond yields now on the rise, the fixed interest markets are pointing in this same direction.
Hmm.
In my last article of 2012 on Friday, I will have a surprise or two for you along with an early suggestion for a New Year's resolution.
If you're a new reader, or need a reminder about some of the methods I refer to in my trades, then do have a look at my introductory videos:
The essentials of tramline trading
An introduction to Elliott wave theory
Advanced trading with Elliott waves
Don't miss my next trading insight. To receive all my spread betting blog posts by email, as soon as I've written them, just sign up here . If you have any queries regarding MoneyWeek Trader, please contact us here.
Get the latest financial news, insights and expert analysis from our award-winning MoneyWeek team, to help you understand what really matters when it comes to your finances.
John is is a British-born lapsed PhD physicist, who previously worked for Nasa on the Mars exploration team. He is a former commodity trading advisor with the US Commodities Futures Trading Commission, and worked in a boutique futures house in California in the 1980s.
He was a partner in one of the first futures newsletter advisory services, based in Washington DC, specialising in pork bellies and currencies. John is primarily a chart-reading trader, having cut his trading teeth in the days before PCs.
As well as his work in the financial world, he has launched, run and sold several 'real' businesses producing 'real' products.
-
 Average UK house price reaches £300,000 for first time, Halifax says
While the average house price has topped £300k, regional disparities still remain, Halifax finds.
-
 Barings Emerging Europe trust bounces back from Russia woes
Barings Emerging Europe trust has added the Middle East and Africa to its mandate, delivering a strong recovery, says Max King