All top traders recognise this warning signal
Learn to recognise the adrenaline rush when your trades are going well, says John C Buford. Then, change course.
Get the latest financial news, insights and expert analysis from our award-winning MoneyWeek team, to help you understand what really matters when it comes to your finances.
You are now subscribed
Your newsletter sign-up was successful
Want to add more newsletters?

Twice daily
MoneyWeek
Get the latest financial news, insights and expert analysis from our award-winning MoneyWeek team, to help you understand what really matters when it comes to your finances.

Four times a week
Look After My Bills
Sign up to our free money-saving newsletter, filled with the latest news and expert advice to help you find the best tips and deals for managing your bills. Start saving today!
"This gold rally is finished". That's how I put it last week. It was a pretty gutsy headline, was it not? I risked having egg on my face.
The market was rising strongly into the $1,300 area at the time.
I was 'long' gold (betting that the price would rise), since it traded for $1,152 last November, and finally cashed out at $1,292 for an impressive $140 profit. At £1 a pip the minimum bet size that was a gain of $14,000 in less than three months.
MoneyWeek
Subscribe to MoneyWeek today and get your first six magazine issues absolutely FREE

Sign up to Money Morning
Don't miss the latest investment and personal finances news, market analysis, plus money-saving tips with our free twice-daily newsletter
Don't miss the latest investment and personal finances news, market analysis, plus money-saving tips with our free twice-daily newsletter
Most traders would be opening the champagne after that kind of gain and crucially, believing they were investment geniuses. The adrenalin rush would be so intense that they would fall in love with their long gold position and perhaps even double-down on their bet. "This thing is going to the moon!"
But you see, that is the opposite of the correct attitude for swing trading. I know it goes against your nature, doesn't it? It goes against mine, too. When the market is going your way, it is perfectly natural to feel elated.
But as an experienced swing trader, I understand the true significance of that feeling. It's a warning.
When I feel that way, when excitement and emotion begins to well up inside me, I've learned that it's time to exit the trade. You have to train yourself to recognise this adrenalin rush and do the opposite of whatever it's telling you.
This isn't easy. But it is a vital skill. You need to learn it.
Why should you do this? You need to remember that you're not the only person who's trading this market. You're excited by the rally but so are most others. And as I've repeated over and over in MoneyWeek Trader, the best way to make profits is to trade against the crowd.
How to think like a trader
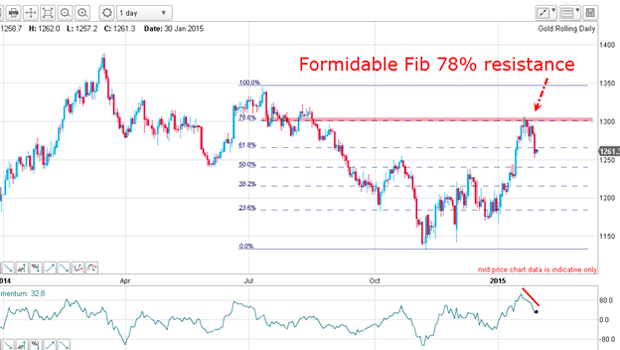
The market bounced right off the Fibonacci 78% level

I highlighted the Fibonacci 78% level in my postof 23January. It's the pink horizontal bar in the chart above.
As you can see, the 78% level proved very significant. As I predicted, the market bounced off the line and headed back downwards.
That trade made money. But even if it hadn't worked out that way, if gold had broken through the 78% level, it would still have been the correct decision given the information we had at that time. All you can do is play the percentages.
If the market had continued to sail away above the $1,300 level, how would I feel at having missed out on extra profit?
Most traders would kick themselves for being so foolish. But that is a very destructive attitude, and to be avoided.
Sometimes you play the percentages, make the correct decision, and the market moves against you. Move on to the next trade.
Fibonacci shows where gold is going next
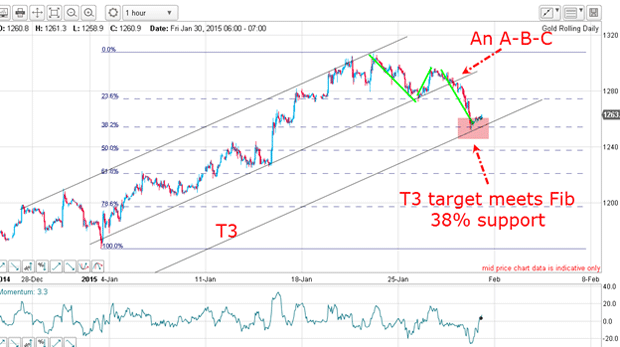
Yesterday, I set up my Fibonacci readings based on the early January low and last week's high. The various Fibonacci levels gave me possible price targets.
Next, I was able to draw a wonderful tramline trio. The lowest of the three tramlines intersected with the Fibonacci 38% level. The 38% level then moved from a possible target to a probable target.
How did the market play out?
Fibonacci, tramlines and Elliott waves combine to show me a price target

Right on cue, the market dipped to that level last night and is currently bouncing back up off of it. Tramlines and Fibonacci combined to give me a highly probable price target.
Where to next for gold? One very important clue to the next likely move is to note the clear Elliott wave A-B-C pattern which can be seen in the decline off the $1,300 high (shown in the chart with green lines). A-B-C is always a counter-trend pattern. The implication? If the $1,250 low can hold the next likely move will be up.
Get the latest financial news, insights and expert analysis from our award-winning MoneyWeek team, to help you understand what really matters when it comes to your finances.
John is is a British-born lapsed PhD physicist, who previously worked for Nasa on the Mars exploration team. He is a former commodity trading advisor with the US Commodities Futures Trading Commission, and worked in a boutique futures house in California in the 1980s.
He was a partner in one of the first futures newsletter advisory services, based in Washington DC, specialising in pork bellies and currencies. John is primarily a chart-reading trader, having cut his trading teeth in the days before PCs.
As well as his work in the financial world, he has launched, run and sold several 'real' businesses producing 'real' products.
-
 Average UK house price reaches £300,000 for first time, Halifax says
While the average house price has topped £300k, regional disparities still remain, Halifax finds.
-
 Barings Emerging Europe trust bounces back from Russia woes
Barings Emerging Europe trust has added the Middle East and Africa to its mandate, delivering a strong recovery, says Max King