A fast-moving trade in the gold market
Spread betting markets can move astonishingly fast, and novice traders can quickly find themselves out of pocket. But it can also lead to big profits, as John C Burford illustrates with this fast-moving gold trade.
Get the latest financial news, insights and expert analysis from our award-winning MoneyWeek team, to help you understand what really matters when it comes to your finances.
You are now subscribed
Your newsletter sign-up was successful
Want to add more newsletters?

Twice daily
MoneyWeek
Get the latest financial news, insights and expert analysis from our award-winning MoneyWeek team, to help you understand what really matters when it comes to your finances.

Four times a week
Look After My Bills
Sign up to our free money-saving newsletter, filled with the latest news and expert advice to help you find the best tips and deals for managing your bills. Start saving today!
Novice spread betters who have previously traded stocks are often amazed at how quickly the spread betting markets can move.
When you factor in the leverage employed, account balances can fluctuate alarmingly.
And that is why you should never over-trade. Changes to your account in the space of minutes and hours can induce medical conditions unless you are prepared!
MoneyWeek
Subscribe to MoneyWeek today and get your first six magazine issues absolutely FREE

Sign up to Money Morning
Don't miss the latest investment and personal finances news, market analysis, plus money-saving tips with our free twice-daily newsletter
Don't miss the latest investment and personal finances news, market analysis, plus money-saving tips with our free twice-daily newsletter
Here's an example of such a trade. In my last email, I posted an example of using the rarely-seen horizontal tramlines in the gold market to time a short-term trade.
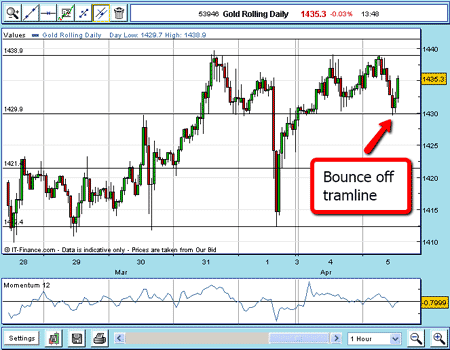
If you recall, the market was approaching an important short-term tramline where a long position was indicated:

(Click on the chart for a larger version)
I promised to follow up this trade and the market has already moved a long way.
What happened next?
In that trade, I went long gold at my lower tramline at $1,430.50, with a protective stop at $1,426.50 for a risk of £40 per £1 bet. That risk was within my 3% rule.
The support held and the market started to rally towards my upper tramline.
As it approached, I thought that if it could punch through this line of resistance, there would be enough power to propel it much higher. There were bound to be many buy-stops above $1,440, as this level was turned back several times before.
I then placed a buy-stop at $1,442 to add to my long position.
This order was hit and now I was long two units.
I then moved my stop up to the average buy price at $1,436.50 to break even if the market turned back through my stop. This is in accordance with my break-even rule.
Remember always have an exit strategy
Now, what is my target for this trade?
If I draw another horizontal tramline equidistant above the $1,439 line, it reaches the $1,448 level. The market quickly reached that level, but did not pause and zoomed straight on.
I then drew yet another tramline above that and it reached the $1,457 level.

(Click on the chart for a larger version)
And that is where the market paused and where I took profits of $26.50 (265 pips) on my first trade and another $15 (150 pips) on the second trade.
That totals 415 pips profit in only a few hours, or a profit of £415 for every £1 bet.
I told you the markets can move quickly!
Congestion zones and springboards
But I will say that I had a sense that the market was building up for a big move, as the shape of the hourly chart was telling me that a lot of buying power was building between the original two tramlines at $1,430 and $1,439.
This is called a 'congestion zone' and normally provides the springboard for a good sharp move when the market decides to break out.
That is not to say that all breakouts are 'genuine'. We often see false breakouts where the market first goes in one direction out of congestion, and then turns tail.
But when this occurs, it is usually a sign that the market is ready to reverse. There are several ways to take advantage of this, and I hope to cover some in future emails.
But to finish with this gold trade, I am out of the market and looking for signals to either go long again or to go short.
I do not hold a religious view about the longer-term forecast. I am content to take profits on either side from a market swing, such as we saw with this trade.
NB: Don't miss my next bit of trading advice. To receive all my spread betting blog posts by email, as soon as I've written them, just sign up here .
Get the latest financial news, insights and expert analysis from our award-winning MoneyWeek team, to help you understand what really matters when it comes to your finances.
John is is a British-born lapsed PhD physicist, who previously worked for Nasa on the Mars exploration team. He is a former commodity trading advisor with the US Commodities Futures Trading Commission, and worked in a boutique futures house in California in the 1980s.
He was a partner in one of the first futures newsletter advisory services, based in Washington DC, specialising in pork bellies and currencies. John is primarily a chart-reading trader, having cut his trading teeth in the days before PCs.
As well as his work in the financial world, he has launched, run and sold several 'real' businesses producing 'real' products.
-
 MoneyWeek news quiz: Can you get smart meter compensation?
Smart meter compensation rules, Premium Bonds winners, and the Bank of England’s latest base rate decision all made the news this week. How closely were you following it?
-
 Adventures in Saudi Arabia
Travel The kingdom of Saudi Arabia in the Middle East is rich in undiscovered natural beauty. Get there before everybody else does, says Merryn Somerset Webb