A contrarian trade in gold's lopsided bull market
Gold has been in a bull market for a long time now. And with so much bullish sentiment, it’s looking very lopsided, says John C Burford, and is in an ideal place to try a short sale.
Get the latest financial news, insights and expert analysis from our award-winning MoneyWeek team, to help you understand what really matters when it comes to your finances.
You are now subscribed
Your newsletter sign-up was successful
Want to add more newsletters?

Twice daily
MoneyWeek
Get the latest financial news, insights and expert analysis from our award-winning MoneyWeek team, to help you understand what really matters when it comes to your finances.

Four times a week
Look After My Bills
Sign up to our free money-saving newsletter, filled with the latest news and expert advice to help you find the best tips and deals for managing your bills. Start saving today!
It has been a while since I covered gold that poster-child for the great inflation scare story that has caught trader's imagination for the past many months.
The powerful theme, of course, is that with a stream of Fed QE money-printing, inflation has only one way to go up, up and away; and with it, the US dollar will surely crash.
Some will say that the dollar already has crashed it is less than one half of its trade-weighted value at the 150 high made in the 1980s.
MoneyWeek
Subscribe to MoneyWeek today and get your first six magazine issues absolutely FREE

Sign up to Money Morning
Don't miss the latest investment and personal finances news, market analysis, plus money-saving tips with our free twice-daily newsletter
Don't miss the latest investment and personal finances news, market analysis, plus money-saving tips with our free twice-daily newsletter
The only real store of value remains the time-tested commodity gold (and to a lesser extent, silver).
With this irresistible story, many have felt the urge to get into these commodities with gusto.
Gold's rampant bull market is looking lopsided
But, as always, I find it a good idea to challenge prevailing opinion and look for contra-trades. And I believe I have found one.
So, with this belief firmly entrenched, both markets have been in major bull markets (bubbles?) until recently.
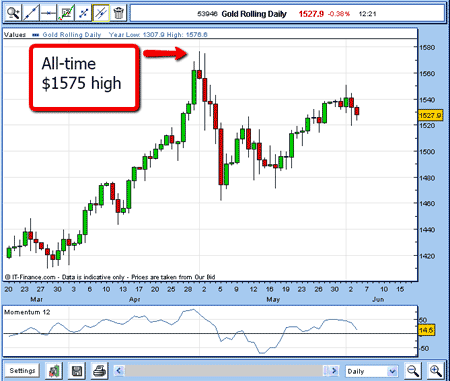
Gold made its all-time high (to date) at $1,575 on 1 May, much later than all other financial markets. On Thursday 2 June, gold was down only $50 from this high.
But with stocks, silver, and crude oil in particular well off their peaks, is it time to ask: "Has gold really topped and will it follow the others down?"
As you know, for guidance, I like to follow what other traders are doing, as that knowledge often gives me clues as to the internal strength or weakness of a market.
One of the tools I use is the 'Commitments of Traders' reports which breaks down the number of outstanding futures contracts held by the various trader categories. Remember, the futures markets drive the cash markets, and they are paramount.
The latest gold futures data shows:
Hedge Funds: 240,000 long; 68,000 short
Small traders: 67,000 long; 22,000 short
The hedge funds are the huge speculators that uninformed people like to demonise. They have no interest in taking delivery of bars of gold, usually. They are like you and me wanting to profit from price movements only, but trade in much larger size.
Remember, for every long position, there is someone short that contract.
The important point here is that when (not if, please note) the gold market cracks, it will fall very heavily, if history is any guide (which it usually is).
Such a lopsided market cannot sustain ever-rising prices. So I am on the look-out for a big break.
Here is the daily chart updated from my last gold post:

(Click on the image for a larger version)
Note the daily 'key reversal' on 1 May, the plunge to the recent low of $1,460, and the rally back up to last Wednesday's high at $1,550.
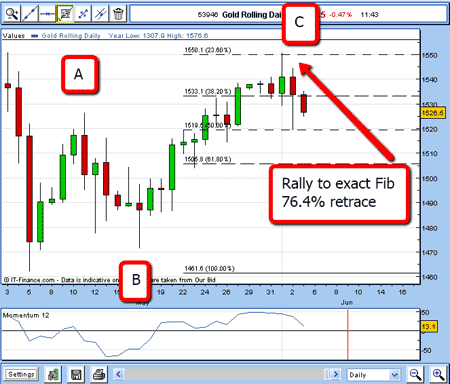
Here is a close-up chart:

(Click on the image for a larger version)
The crucial point is that the $1,550 level is the exact Fibonacci 76.4% retrace of the decline from the $1,575 all-time high and the recent $1460 low.
And the three-wave A-B-C pattern is classic Elliott wave corrective action.
This is an ideal place for a short sale
Whether you are a gold-bug or not, this is an ideal place to try a short sale!
Why? Simply because this level very often offers big resistance to further rallies and we can expect at least a pull-back, enabling use of my break-even rule.
So, at worst, our short trade will likely be a wash (no profit or loss) and at best, our trade has the potential to be a big winner.
With these odds, what's not to like?
In fact, if you only focused on this type of trade using the same Fibonacci retrace levels for your entry points (either long or short), I believe your trading history will show more winners than losers.
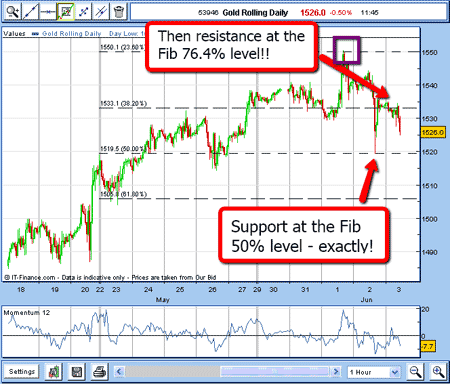
OK, now let's see how our short trade is working as of this Friday morning. Here is the latest chart:

(Click on the image for a larger version)
Yesterday, the market fell right back to the Fibonacci 50% support at $1520, then rallied back to the Fibonacci 61.8% level and is now backing away and re-challenging the $1520 area.
We can leave our protective stop at break-even for now and if the trade keeps in our favour, we can look to move it down.
But keep in mind that gold tends to be a spiky market, and we do not want to be stopped out prematurely.
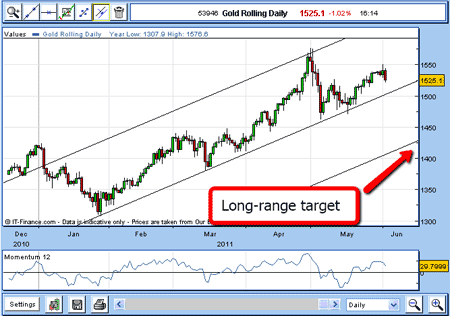
Here are my tramlines on the hourly chart:

(Click on the image for a larger version)
Support at $1,530 is shown with purple bar and since my centre tramline has been broken, my next target is the lowest tramline.
I shall continue with this trade until closed out.
NB: Don't miss my next trading insight. To receive all my spread betting blog posts by email, as soon as I've written them, just sign up here .
Get the latest financial news, insights and expert analysis from our award-winning MoneyWeek team, to help you understand what really matters when it comes to your finances.
John is is a British-born lapsed PhD physicist, who previously worked for Nasa on the Mars exploration team. He is a former commodity trading advisor with the US Commodities Futures Trading Commission, and worked in a boutique futures house in California in the 1980s.
He was a partner in one of the first futures newsletter advisory services, based in Washington DC, specialising in pork bellies and currencies. John is primarily a chart-reading trader, having cut his trading teeth in the days before PCs.
As well as his work in the financial world, he has launched, run and sold several 'real' businesses producing 'real' products.
-
 ISA fund and trust picks for every type of investor – which could work for you?
Whether you’re an ISA investor seeking reliable returns, looking to add a bit more risk to your portfolio or are new to investing, MoneyWeek asked the experts for funds and investment trusts you could consider in 2026
-
 The most popular fund sectors of 2025 as investor outflows continue
It was another difficult year for fund inflows but there are signs that investors are returning to the financial markets