What are 'key reversals' and 'outside weeks'?
Many stock markets recently experienced a tumultuous 'outside week' with new highs followed by new lows and several 'key reversals'. For traders, these can be very powerful signals that pinpoint market tops and bottoms. Veteran spread better John C Burford explains what they are and how to take advantage.
Get the latest financial news, insights and expert analysis from our award-winning MoneyWeek team, to help you understand what really matters when it comes to your finances.
You are now subscribed
Your newsletter sign-up was successful
Want to add more newsletters?

Twice daily
MoneyWeek
Get the latest financial news, insights and expert analysis from our award-winning MoneyWeek team, to help you understand what really matters when it comes to your finances.

Four times a week
Look After My Bills
Sign up to our free money-saving newsletter, filled with the latest news and expert advice to help you find the best tips and deals for managing your bills. Start saving today!
As I write, we have finished one of the most tumultuous weeks in the markets (1-6 May) that I have experienced in years. Not only was the ten-year hunt for bin Laden finally concluded (on 1 May a traditional day of celebration, please note), but the darling of the anti-fiat currency army silver was knocked for six with a third sliced off its value.
The week started so well with the bin Laden news kicking the markets off in a bullish mood on Monday. Many markets made new highs.
But then the rout started, leaving many traders shell-shocked on Friday and much poorer.
MoneyWeek
Subscribe to MoneyWeek today and get your first six magazine issues absolutely FREE

Sign up to Money Morning
Don't miss the latest investment and personal finances news, market analysis, plus money-saving tips with our free twice-daily newsletter
Don't miss the latest investment and personal finances news, market analysis, plus money-saving tips with our free twice-daily newsletter
Of course, there is the inevitable post mortem going on as I write. Many articles have popped up 'explaining' how the wipe-out was healthy for the on-going bull markets, and that they will resume their upward trend soon. They all saw it coming, of course.
Naturally, as silver prices tanked, bullish sentiment followed alongside. The Daily Sentiment Index (see my previous post for more on this) reading that had registered a near-record 96% on Friday 29 April when silver was hitting $50, plunged to 48% on Friday 6 May.
That is some change of heart!
To summarise, many markets made new highs early in the week, then moved sharply lower to close lower than the previous week's close.
To technical analysts, this is called a 'key reversal'.
As its name suggests, it signifies a reversal in the trend, and it is highly prized by chart-based traders, such as myself.
This is because, after a long trending period, it very often does mark the point where the trend changes to the opposite direction. But of course, there are no guarantees.
Last week was great for key reversals and that's not all
We had key reversals in several markets last week. But that is not all!
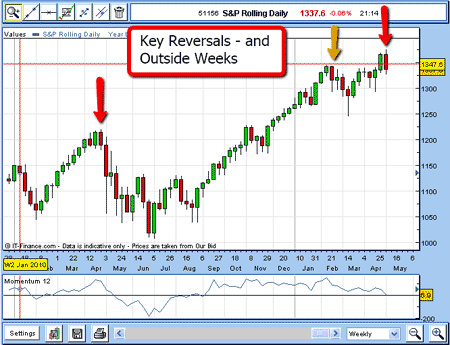
If you examine the weekly chart of the S&P Index, you will notice last week's trading range (the extent of the high and the low) overlaps the previous week's range. The intra-week high is higher, and the low is lower than in the previous week.
This is called an 'outside week'.

(Click on the chart for a larger version)
You will see a key reversal/outside week almost exactly a year ago (red arrow) which front-ran a very large correction.
The yellow arrow points to a key reversal week, but no outside week the correction was made, but was limited.
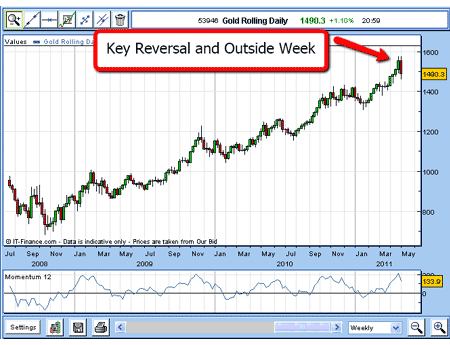
You will find many examples on daily charts, but these are quite rare on the weeklies. And when it coincides with a key reversal on a weekly chart, it is a very powerful signal.
Here is the gold weekly chart:

(Click on the chart for a larger version)
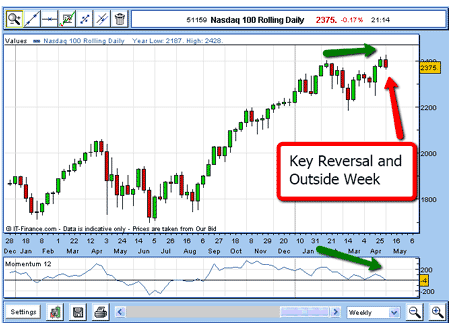
And the Nasdaq:

(Click on the chart for a larger version)
Note the weakening momentum readings at last week's highs (green arrows) these are negative divergences and yet one more clue.
Were these key reversals limited to these markets? Not at all here is a list of just some important markets:
Key Reversal
Dow Jones Index
DAX
Key Reversal + Outside Week
Crude Oil
Euro
Aussie dollar
Gold
Silver
Nasdaq
S&P
Dollar Index (reverse)
CRB Commodity Index
With key reversal/outside weeks in all these markets, traders need to take note.
I would encourage any trader to examine their historic charts and discover for themselves whether the key reversals and outside weeks in the past have pinpointed the tops and bottoms.
Happy hunting!
NB: Don't miss my next trading insight. To receive all my spread betting blog posts by email, as soon as I've written them, just sign up here .
Get the latest financial news, insights and expert analysis from our award-winning MoneyWeek team, to help you understand what really matters when it comes to your finances.
John is is a British-born lapsed PhD physicist, who previously worked for Nasa on the Mars exploration team. He is a former commodity trading advisor with the US Commodities Futures Trading Commission, and worked in a boutique futures house in California in the 1980s.
He was a partner in one of the first futures newsletter advisory services, based in Washington DC, specialising in pork bellies and currencies. John is primarily a chart-reading trader, having cut his trading teeth in the days before PCs.
As well as his work in the financial world, he has launched, run and sold several 'real' businesses producing 'real' products.
-
 Adventures in Saudi Arabia
Travel The kingdom of Saudi Arabia in the Middle East is rich in undiscovered natural beauty. Get there before everybody else does, says Merryn Somerset Webb
-
 ISA fund and trust picks for every type of investor – which could work for you?
Whether you’re an ISA investor seeking reliable returns, looking to add a bit more risk to your portfolio or are new to investing, MoneyWeek asked the experts for funds and investment trusts you could consider in 2026