In my last email, I analysed the chart of gold and said it was at a crossroads. The events of the past 48 hours have proved how right I was! Having chosen one path, it promptly turned tail and ran the other way!
What seemed like a normal resumption of the uptrend has, in the space of a few hours, now turned 180 degrees. Now it appears we are heading down!
If you recall, the price was trundling up a very well defined uptrend line since January:
Try 6 free issues of MoneyWeek today
Get unparalleled financial insight, analysis and expert opinion you can profit from.

Sign up to Money Morning
Don't miss the latest investment and personal finances news, market analysis, plus money-saving tips with our free twice-daily newsletter
Don't miss the latest investment and personal finances news, market analysis, plus money-saving tips with our free twice-daily newsletter
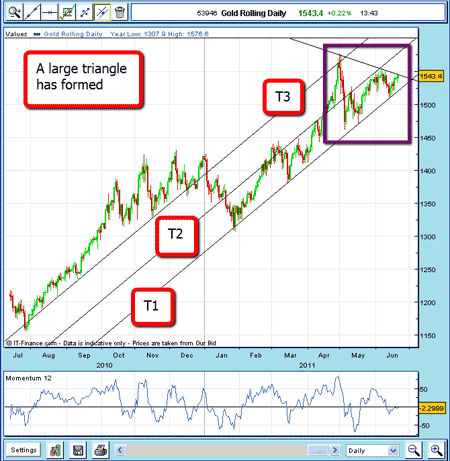
It was also hitting against the solid downtrend line drawn off the all-time 1 May high. I gave two possible scenarios and one of them was for a breakout above the downtrend line to continue the uptrend.

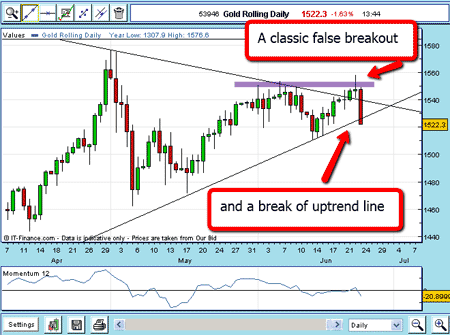
On Wednesday, the market zoomed through the line by around $10 and then retreated back down to the line by the close.
I said that a good trade would be to place a buy stop to enter just above the line. If that was done, there was ample time to move protective stops to break even, following my break even rule. That would have prevented a big loss, as the market has since tumbled to below $1520.
The move up is what we call a false breakout'.
Also recall that I said that the bull market was intact until the major uptrend line is broken. That has happened.
(Click on the chart for a larger version)
The breakout also took out the previous high of 6 June, where there were many buy-stops lurking (marked by purple line) there always are stops bunched at a major high (sell stops at lows). Professional traders love these as they are usually selling into the buying.
They figure that when that buying is exhausted, prices will fall back and that is exactly what happened here.
Now the major uptrend line has been broken, now what?
Support lies at T1 between $1490 and $1500.
Now you may ask why is gold falling when currencies are collapsing, the eurozone crisis worsens, central banks are loading up, and the chorus of advisors are telling us to do likewise?
To me, expectations for the price to reach $1,800, $2,000, even $5,000 have become commonplace. And we all know that markets exist to frustrate the majority.
Just when most people become comfortable buying into a story', that is usually when the game changes. Last time, I showed how one-sided the gold futures market had become with the commitments of traders report.
The market has been ripe for disappointment for some time. I do read many blogs and the one impression I get is complacency over gold. It is taken as read that it will keep going up, and dips should be bought.
Well, US and UK homeowners know how that theory worked out with their house prices. Before they topped, most people believed that down was next to impossible.
Even the most bullish gold commentators allow for a dip this summer before going on to new highs later this year. I have yet to read an article advocating outright shorting gold. The complacency is palpable.
And that offers an opportunity for nimble traders!
Friday morning update
Here is the latest chart showing the very oversold momentum reading yesterday (marked with purple box):
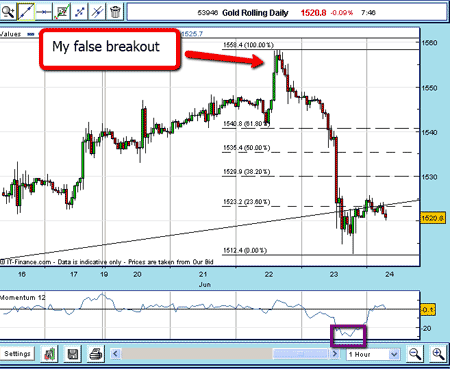
I have applied my Fibonacci levels to yesterday's big wave down, but as of this morning, the bounce has been anaemic, so far. It has only carried to the Fibonacci 23% retrace as the momentum overshoot is being corrected.
Also, note the proximity to my long-term uptrend line. A decisive move down here would, I believe, produce more selling. A move up, though, would probably mean slightly higher prices, at least in the short-term.
This terrific example of a false breakout shows vividly that we can never be off our guards as traders and why I use my break even rule to protect capital.
NB: Don't miss my next trading insight. To receive all my spread betting blog posts by email, as soon as I've written them, just sign up here .