A brief history of market panics
SPONSORED CONTENT - The coronavirus outbreak is just the latest case in the long history of market volatility.

History suggests that every once in a while, markets and investors panic. The frequency of these panics is clearly unpredictable – as they are usually caused by unpredictable events – but outbreaks of extreme market turbulence tend to pop up every few years. Recent events connected to the coronavirus outbreak are just the latest manifestation of a surge in what’s called market volatility.
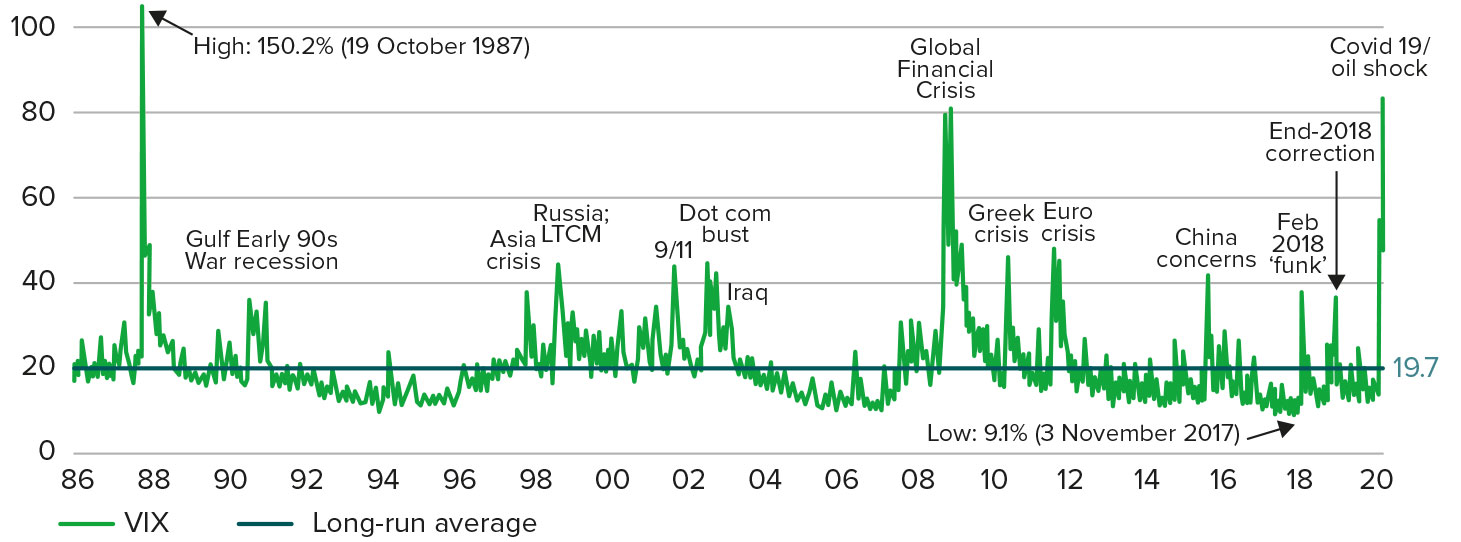
This is a technical-sounding term which measures the ebb and flow of markets, usually (though not exclusively) the US market, as captured by the S&P 500 index. The main index of volatility in the US is called the Vix. For context, most of the time this index is somewhere in a range between 10 and 20. But on 12 March 2020 – at the height of the most recent panic – this measure spiked above 80 to 82.62. That was a jump of nearly 25 index points in just one extraordinary day.
This surge was shocking – but not unique. We had previously seen a 20-point jump on 5 February 2018, a 16-point jump on 22 October 2008 and a 16-point surge on 8 August 2011. So as market turbulence goes, this was a big one, but the sheer scale of the turbulence was not entirely unprecedented. The chart of the Vix below is from academics who write a report for investment bank Credit Suisse about long-term investing. It puts the most recent spike in turbulence into a wider historical context. Its message is clear – markets panic regularly.
MoneyWeek
Subscribe to MoneyWeek today and get your first six magazine issues absolutely FREE

Sign up to Money Morning
Don't miss the latest investment and personal finances news, market analysis, plus money-saving tips with our free twice-daily newsletter
Don't miss the latest investment and personal finances news, market analysis, plus money-saving tips with our free twice-daily newsletter

What happens when markets panic?
Another way of looking at this and previous panics is to look at how far big markets can fall in extreme conditions, from “peak to trough”. At the nadir of the most recent plunge, the S&P 500 was down more than 37% from its recent peak. That sounds terrible, but it’s not even remotely unprecedented. Solomon Tadesse, an analyst at big French investment bank Societe Generale, recently mapped out the big sell-offs – or bear markets – we’ve seen over the last 150 years. During that period we’ve seen 15 different sell-offs where losses totalled more than 30%. Four of those (excluding the most recent) came in the last four decades. And the two most recent (2001 and 2009) triggered declines of roughly 50%.
Of course, the corollary of all this is that while markets do panic regularly, they also rebound when the panic fades. The same academics behind that Credit Suisse report also looked at how long spikes in market turbulence typically last, before calm returns. After examining 14 volatility spikes over the last 40 years, they found that the turbulence lasts for about 86 days on average, with only a few outliers lasting more than 150 days. In other words, the optimists do eventually triumph. Panic recedes, confidence returns and markets start to move back up again – but only after the initial panic has subsided.
How might investors react to this dynamic ebb and flow of fear and greed within markets? Conventional wisdom has it that what matters is your risk appetite, which itself is based on your own attitude towards uncertainty and loss aversion. But most academics will suggest that what really matters is your "time window", i.e. how long your investing time horizon is.
Invest for the long term
If you might need access to your investments within the next two to five years, then investing in risky equities – which as we’ve just demonstrated, go up and down with great regularity – might not be the best strategy. Pick the wrong years to invest and you might lose as much as 50% of your capital and then only have a short period of time to recover that. Remember that if markets fall by 50% in one year and you invest say £1,000 at the beginning, you’ll be left with £500 in the trough. If markets then rebound 50% from that trough, you’ll still only have £750 after the rebound.
By contrast, if your time horizon is 20 years, you should easily be able to survive maybe one or two outbreaks of market mayhem, and still be ‘in the game’ to benefit from the rebound. And after that rebound, it’s not at all abnormal to expect a return to something approximating “normal” market returns. And what might these “normal” returns look like? As a very rough and ready rule (and with the usual caveat that the past is not necessarily a guide to the future), most academics and market analysts reckon that over the long term equities (stocks and shares) have returned something like 6% a year (give or take a percent).
Discover more of the latest investment views and ideas from Liontrust’s experienced fund managers.
Get the latest financial news, insights and expert analysis from our award-winning MoneyWeek team, to help you understand what really matters when it comes to your finances.
MoneyWeek is written by a team of experienced and award-winning journalists, plus expert columnists. As well as daily digital news and features, MoneyWeek also publishes a weekly magazine, covering investing and personal finance. From share tips, pensions, gold to practical investment tips - we provide a round-up to help you make money and keep it.
-
 Should you buy an active ETF?
ETFs are often mischaracterised as passive products, but they can be a convenient way to add active management to your portfolio
-
 Power up your pension before 5 April – easy ways to save before the tax year end
With the end of the tax year looming, pension savers currently have a window to review and maximise what’s going into their retirement funds – we look at how

