Get the latest financial news, insights and expert analysis from our award-winning MoneyWeek team, to help you understand what really matters when it comes to your finances.
You are now subscribed
Your newsletter sign-up was successful
Want to add more newsletters?

Twice daily
MoneyWeek
Get the latest financial news, insights and expert analysis from our award-winning MoneyWeek team, to help you understand what really matters when it comes to your finances.

Four times a week
Look After My Bills
Sign up to our free money-saving newsletter, filled with the latest news and expert advice to help you find the best tips and deals for managing your bills. Start saving today!
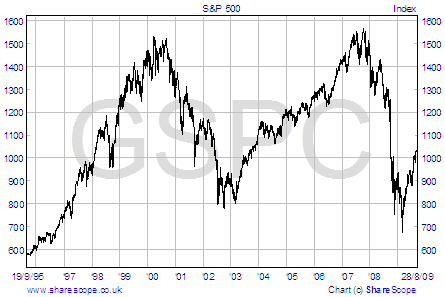
There are many parallels one can draw with the stock market rally we have seen since mid-March (earlier in emerging markets) and that of the start of the last major stock market rally between 2003 and 2007. Many investors appear to believe that, just like then, this is the start of a much longer bull market that could go on to reach the heights of the previous two bull markets. However, there are a number of reasons why this rally is very different from that of 2003.
A good reason for comparing this rally with that in 2003 is that it began in the trough between the peaks of 2000 and 2007. If you look at 15-year charts for the S&P 500, the Nikkei 225, the FTSE All Share, the FTSE 100 and the CAC 40, you will see that they all shared double-top formations with markets peaking at similar levels in 2000 and 2007. None of them have exactly the same pattern, but there are clear similarities in the key index levels. The second interesting similarity is that each of these markets also bottomed out at around the same level in 2003 and 2009.

The bull market in stocks that peaked in 2000 was a big one. The S&P 500 had a P/E of 46 by the end of 2001. The market fell until the first half of 2003 before bottoming out.
MoneyWeek
Subscribe to MoneyWeek today and get your first six magazine issues absolutely FREE

Sign up to Money Morning
Don't miss the latest investment and personal finances news, market analysis, plus money-saving tips with our free twice-daily newsletter
Don't miss the latest investment and personal finances news, market analysis, plus money-saving tips with our free twice-daily newsletter
The story behind the 2000-2003 market decline was very much about valuations. Stock prices had become far too inflated relative to earnings, but that wasn't the case when markets peaked in 2007.
At the end of December 2007 the PE for the S&P 500 was 19.84, which is not cheap but is lower than in 2000 when it stood at 26, and especially compared to the 2001 valuation of 46. Instead of a simple overvaluation of stocks, the boom that led up to 2007's peak was fuelled by increased earnings that had been inflated by a massive expansion in credit at the customer and corporate level.
A stock valuation which is inflated by exuberant investors is easily corrected by a stock market fall. But when the problem is of a more fundamental nature, then a simple stock market correction does not solve the underlying problem.
The 2000 bull market was fuelled by a bubble in stock valuations and when interest rates were lowered it was followed by a bubble in the accessibility of credit that fed into many elements of the wider economy. High market peaks leave investors with high expectations for future market peaks. If we are to see stock markets 'recover' to former levels within the next decade then it would appear that we need either a major positive fundamental change to the way the economy works or we need another bubble.
There are several important differences between the economic environment of today and that of 2003 which suggest that this market rally might not be sustainable.
From 2002, US GDP was never technically in recession and in the period from 2000 to 2007 it never contracted for more than one quarter at a time, having shown negative growth on just two occasions. Conversely, from Q2 2008, US GDP contracted for 4 quarters in a row which suggests that the economy is in considerably worse shape today than it was during the last stock market crash. Many countries have experienced negative GDP growth whereas they didn't during the last downturn.
The 2003 rebound was fuelled by pent up consumer demand that had been dampened after the 2000 stock market crash and also by the negative effect of 9/11. US household consumption rose every year from 2000 to 2007. In 2003 consumers had the ability to spend, whereas today they are far more indebted and they have more restricted access to credit, both of which will severely curtail their spending.
Today consumers are also more likely to be out of work. From 2000 to 2003 the US unemployment rate rose from 4% to 6%, which was a significant increase but was nothing compared to the change since mid-2007, when the US unemployment rate rose from 4.7% to 9.4% by July 2009.
This year we have seen total US household debt shrinking, whereas in 2002 and 2003 it was still growing as consumers were able to use money released from home equity for other spending.
US house prices rose every year from 2000 to 2006. This was a major boost to spending power and consumer confidence which is completely missing today and which is not likely to return in a hurry.
The flipside of the negative factors above is that government intervention during the last downturn was nowhere near as significant as today. Whilst quantative easing and the purchase of government bonds are an attempt to restore 'normality' to lending costs, the wider economy should today also feel the positive effects of the subsidies for new cars, and tax cuts such as the UK cut in VAT and the US income tax rebates. However, these schemes have had limited success because they bring forward spending that would have occurred later or they divert spending away from other areas of the economy. Some of this money has also been used to pay down debt or to rebuild savings. We also know that such methods of stimulation can't be sustained indefinitely.
The evidence shows us that much of the global economy is in a worse state today than it was in 2003 and that many of the problems that led to the credit crunch have not yet been solved. GDP growth in developed economies is forecast to be extremely weak for the foreseeable future, company directors who are selling their own stock outweigh those buying by a record amount, there are a record number of homeowners in negative equity (8m in the US) and 9% of US mortgage holders have defaulted, having missed at least one monthly mortgage payment.
The factors highlighted above would tend to suggest that a recovery in corporate profits is far less certain than stock markets would have us believe; but several major stock markets have fallen no further than they did in the last bear market and this is supposed to be telling us that the worst recession since the 1930s actually had a relatively limited impact on corporate profits. The next question is whether we can expect a new downward leg of the bear market to new lows, or whether government intervention ensures that we only suffer a relatively minor correction and markets remain on life support.
The Japanese were criticised for supporting 'zombie' banks during the lost decade of the 1990s and it was this approach that was blamed for prolonging the severity of the downturn after their own stock and property market bubbles popped. I would argue that the leaders of the US and Europe are equally guilty of avoiding the need to take painful decisions and they are failing to address the underlying problems of the economy. Debt is being shifted from the private sector onto the taxpayer's shoulders, companies that should fail are being saved and over-indebted consumers are being incentivised to spend their way out of an economic crisis that was brought about by over-spending. These are short term solutions to long term problems and it is difficult to see what will provide the power to drive a sustainable stock market recovery.
The factors that enabled the 2003-2007 bull market are not in place and there are no obvious alternatives in sight.
This article was written by Richard McCreery, founder of investment advisory business RM Wealth Management and senior financial advisor with Stewart Asset Management Monaco.
Get the latest financial news, insights and expert analysis from our award-winning MoneyWeek team, to help you understand what really matters when it comes to your finances.
MoneyWeek is written by a team of experienced and award-winning journalists, plus expert columnists. As well as daily digital news and features, MoneyWeek also publishes a weekly magazine, covering investing and personal finance. From share tips, pensions, gold to practical investment tips - we provide a round-up to help you make money and keep it.
-
 Barings Emerging Europe trust bounces back from Russia woes
Barings Emerging Europe trust has added the Middle East and Africa to its mandate, delivering a strong recovery, says Max King
-
 How a dovish Federal Reserve could affect you
Trump’s pick for the US Federal Reserve is not so much of a yes-man as his rival, but interest rates will still come down quickly, says Cris Sholto Heaton

