Get the latest financial news, insights and expert analysis from our award-winning MoneyWeek team, to help you understand what really matters when it comes to your finances.
You are now subscribed
Your newsletter sign-up was successful
Want to add more newsletters?

Twice daily
MoneyWeek
Get the latest financial news, insights and expert analysis from our award-winning MoneyWeek team, to help you understand what really matters when it comes to your finances.

Four times a week
Look After My Bills
Sign up to our free money-saving newsletter, filled with the latest news and expert advice to help you find the best tips and deals for managing your bills. Start saving today!
It is almost certain that the stock markets' current bear market rally is about to blow up. What will follow is the resumption of the bear market, which will lead to a testing of the March lows.
The series of signals that will confirm the bear market resumption are as follows:
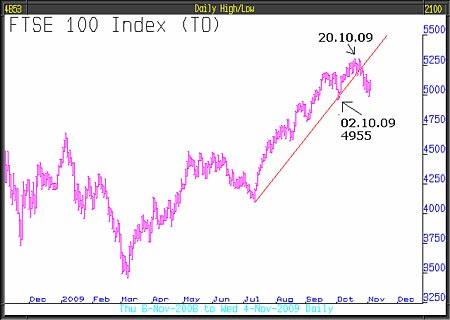
As can be seen from the FTSE chart shown below, the uptrend from July has now failed, and a decisive top may be forming. That top would be confirmed on FTSE closing below 4955, the 2 October low.
MoneyWeek
Subscribe to MoneyWeek today and get your first six magazine issues absolutely FREE

Sign up to Money Morning
Don't miss the latest investment and personal finances news, market analysis, plus money-saving tips with our free twice-daily newsletter
Don't miss the latest investment and personal finances news, market analysis, plus money-saving tips with our free twice-daily newsletter
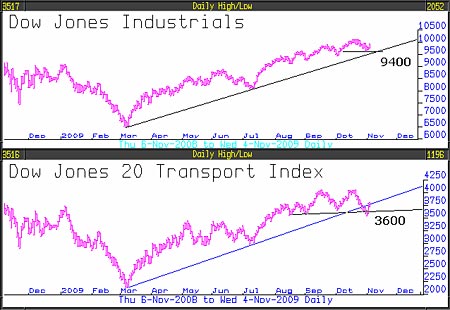
The second signal will come from Dow Theory. As can be seen from the two charts below, the Industrials are still in a positive trend whilst the Transports have topped out. The two key levels are 9400 for the Industrials and 3600 for the Transports. On both of these closing below those levels, we would have an unquestioned Dow Theory bear market signal.
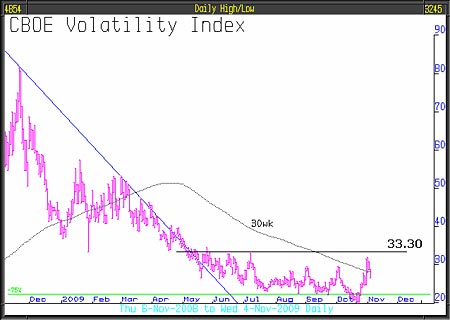
The VIX has been one of our regular 'wrong notes', our original signal above 29.57 occurred this week. However, we have since seen a modest pull back. We would now revise our signal slightly higher to 33.30. A close above that would be sufficient together with the other signals for us to say with confidence that the Bear Note is going to deliver as expected.
Andrew Smithers who ten years ago wrote "Valuing Wall Street", more recently "Wall Street Revalued", in recent research calculated that the S&P500 is at present 40% overvalued. If the S&P500 were to fall to around fair value, which is eminently likely, we would also expect FTSE to fall by a similar amount which would bring it close to the March low. Primary bear markets invariably end well below fair value, which suggests a final bottom for FTSE below 3000.
The primary bear market's resumption would take the consensus by surprise and create a shuddering reaction which, in turn, would have huge negative implications for consumer spending and corporate investment. The valuations of companies will necessarily decline further. Like a beautifully constructed firework display, the logical action and reaction, what Soros calls "reflexivity", will change entire perceptions about the economy and the value of assets.
The slightly better than expected US third quarter GDP growth figure compromised 92% non recurring items said John Williams of Shadow Government Statistics, who provide analysis behind and beyond US government economic reporting. Furthermore, consumer sentiment had in the meantime fallen to a 26-year low on the fear of rising unemployment.
America's claim that their recession is over because of the latest GDP figure needs to be seen in its proper perspective: the National Bureau of Economic Research provide the official measure of recession. So far all they have said is that it started in December 2007; they have not, as yet, said it has ended. That may be because post war recessions have invariably included at least one quarter of positive economic growth; so one might almost say that this, the worst recession since the 1930s, has satisfied a key criterion that confirms its greater longevity, not its demise.
Gillian Tett, the highly regarded financial journalist who writes for the Financial Times, recently wrote a piece about a newly retired banker who had returned to visit his old colleagues. He discovered that nothing seemed to have changed. In the e-mail he sent to Gillian, that she published, he said "Any sense of control is being chucked out of the window. After the dot com boom and bust it took a good few years for the market to get its creative mojo back [but] this time it has taken just a few months". He went on to say "Was October 2008 just a dress rehearsal for a crash when this latest bubble bursts".
Dow Theory says that no matter what the authorities do, they cannot change the direction of the primary trend although they can, in the short term, interfere with it. That is what we are witnessing in the stock markets and in the property market. It also means that the primary bear markets will prevail.
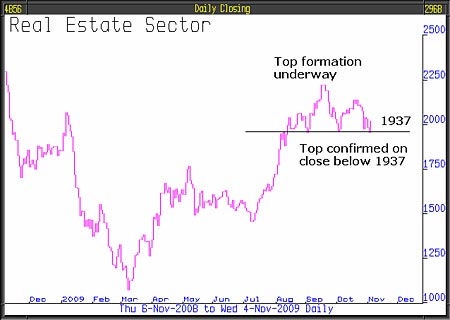
For commercial property loans where loan covenants have been breached, banks have been encouraged not to exercise their rights. The effect of this has been to limit supply. Property prices have accordingly increased because of the lack of supply rather than because of genuine mounting demand. To verify the true outlook for property values, we look at the real estate sector of the stock market. It is made up of property companies that own the properties that are thought to be increasing in value. This is key because equities are a forecasting mechanism. If the market genuinely believed that property values were set to rise significantly, the equities should be anticipating that and, ahead of time, would have increased greatly in value.
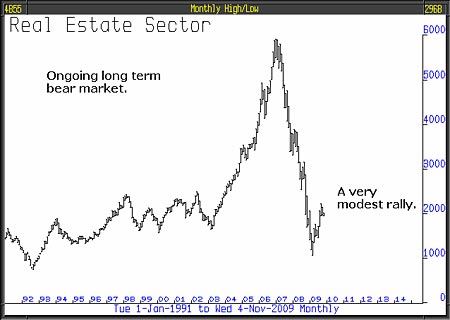
The long term chart of the real estate sector tells us what's happening. You can see that the monstrous bear market that started in 2008 has enjoyed only a small bounce and is unfinished business. The rally hardly squares the circle that property prices are in proper recovery, in fact, we would say that the chart suggests that where property prices have risen, they are now poised precariously and destined to dramatically fall in value.

Special FREEreport from MoneyWeek magazine: When will house prices bottom out - and how will you know?
- Why UK property prices are going to fall 50%
- When it will be time to get back in and buy up half price property
To understand more about what is likely to happen next, we study the one year chart. What we see is adverse short term action at the chart's recent high. Any technical analyst looking at it would recognise a well defined head and shoulders top with the support/neck at 1,937. A close meaningfully below 1,937 would be a very negative signal for commercial property values.
Economic strength cannot persist if universal retrenchment continues. The news is that companies are hoarding more cash than for forty years; 9.8% as a percentage of their assets compared to 7.9% only a year ago. For the half of S&P 500 companies to so far report earnings, the cash figure is 11.1% in the third quarter compared to 10.1% for the second quarter if most companies don't spend, most companies will suffer reduced revenues and lower profits and economic activity can't recover.
This article was written by Full Circle Asset Management, and was published in the threesixty newsletter on 05 November 2009
Get the latest financial news, insights and expert analysis from our award-winning MoneyWeek team, to help you understand what really matters when it comes to your finances.
MoneyWeek is written by a team of experienced and award-winning journalists, plus expert columnists. As well as daily digital news and features, MoneyWeek also publishes a weekly magazine, covering investing and personal finance. From share tips, pensions, gold to practical investment tips - we provide a round-up to help you make money and keep it.
-
 Barings Emerging Europe trust bounces back from Russia woes
Barings Emerging Europe trust has added the Middle East and Africa to its mandate, delivering a strong recovery, says Max King
-
 How a dovish Federal Reserve could affect you
Trump’s pick for the US Federal Reserve is not so much of a yes-man as his rival, but interest rates will still come down quickly, says Cris Sholto Heaton

