Get the latest financial news, insights and expert analysis from our award-winning MoneyWeek team, to help you understand what really matters when it comes to your finances.
You are now subscribed
Your newsletter sign-up was successful
Want to add more newsletters?

Twice daily
MoneyWeek
Get the latest financial news, insights and expert analysis from our award-winning MoneyWeek team, to help you understand what really matters when it comes to your finances.

Four times a week
Look After My Bills
Sign up to our free money-saving newsletter, filled with the latest news and expert advice to help you find the best tips and deals for managing your bills. Start saving today!
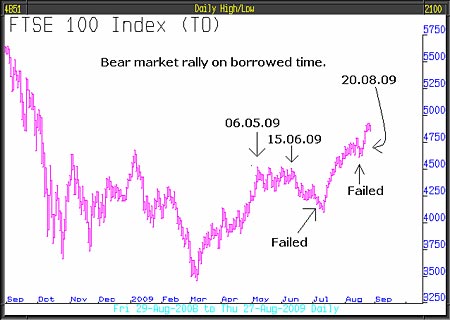
From 6 May until 15 June, the FTSE consolidated and then declined. We thought this was the resumption of the primary bear market; instead, FTSE rallied strongly. In August, for the second time, we thought the bear market might have resumed. It didn't and the stock market rallied again, but this time for only three days starting Thursday 20. Since then it has stalled, possibly this time the bear market will resume, as sooner or later it surely must.
We find the scale of this post-March rally unbelievable; it suggests a reckless level of speculation. This bear market rally is living on borrowed time, in dangerous territory. Watch what happens next because such irrational behaviour by investors is likely to end suddenly and dramatically.
Speculation is rife. The average holding period for stocks has fallen to less than twelve months. The last time it was this short was in the 1920s. Jake Bernstein's daily sentiment index is at 89% compared to a normal bull market level of 60% to 70%, the most extreme reading since the top of the market in 2007 another pointer to excessive speculation.
MoneyWeek
Subscribe to MoneyWeek today and get your first six magazine issues absolutely FREE

Sign up to Money Morning
Don't miss the latest investment and personal finances news, market analysis, plus money-saving tips with our free twice-daily newsletter
Don't miss the latest investment and personal finances news, market analysis, plus money-saving tips with our free twice-daily newsletter

We have,previously referred to a "wrong note". For example, a strong stock market at the time of a strong gilt market, a consolidating VIX (volatility) and a decline in the Baltic Dry Index (shipping freight). We are not alone, today Thursday 27 August in the Financial Times, Michael McKenzie, in a half page article under the headline Questions over strength of recovery said: "Amid the thin trading volumes of this sluggish August, investors have been caught off balance as the normal relationships between US equities, government bonds and commodity prices have broken down." He is also hearing wrong notes!
We have discussed previously the concept of "universal retrenchment"; simultaneously, companies improve their profits by reducing staff and cutting back on capital investment. Second quarter earnings for the S&P 500 companies were better than expected but this was primarily as a result of "universal retrenchment". However, and here's the rub, one company's expenditure is another company's earnings. So if the majority of companies increase their profits by cutting back on staff and expenditure, all companies' revenues will drop, causing them to make more cutbacks. "Universal retrenchment" is like running in ever decreasing circles and we know where that ends up!
WPP's half-year results gave us a pointer to what is going on. There's an old joke, when companies hit hard times they sack their salesmen and cancel advertising, then wonder why business gets worse. WPP say that's what's going on. They had expected revenue to fall 4% compared to the previous six months, in fact it fell 8% and their pretax profits fell 47%. Also, their margin was squeezed from 13.6% to 8%. Sir Martin Sorrell said that in his opinion "Market share is being bought by sacrificing pricing in many sectors."
Companies are not getting better; punters are just willing to pay more for their shares. Whilst they are doing that it should come as no surprise to learn that in July, insiders (senior executives of companies) took advantage of investors' generosity and sold $3 billion value of shares and only bought $90 million a ratio of 33/1 insiders must know something.
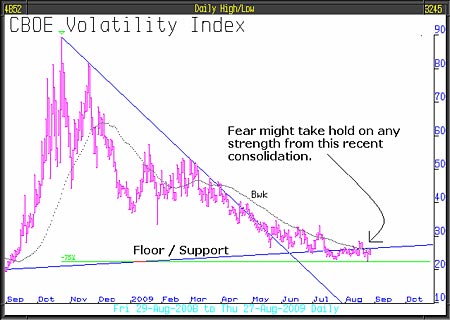
In spite of the most recent strength of the S&P 500, the VIX the index gauge of fear continues to consolidate above 20. We reported two weeks ago that we watch for a clear signal, if it spikes up from here that would mean fear was returning and a dramatic reversal in the direction of the stock market could happen. The fact that it is consolidating, at a still elevated level, suggests that is likely.

George Magnus, senior economic adviser at UBS Investment Bank, covered these issues rather succinctly when he recently wrote in the FT: "Financial markets need confidence in self-sustaining economic growth, which the deleveraging cycle has compromised. Without credit, demand growth depends on aggregate demand and income, both of which are liable to deteriorate further in the coming year. Household consumption will remain depressed as record household debt ratios are reduced. Savings continue to be rebuilt, and many households cope with negative household equity. Company balance sheets have been under pressure too. In the second quarter, the US enjoyed a 6.4% annualised growth in productivity. But having exhausted non-labor cost-cutting opportunities, companies have been cutting man-hours faster than output has fallen. This hardly bodes well for household consumption."
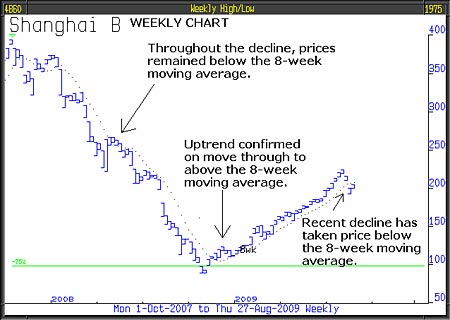
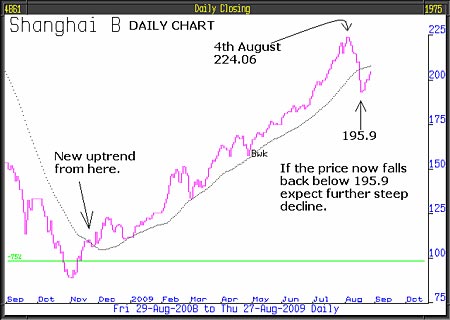
At the start of November last year, the Chinese stock market decoupled from the rest of the world and started an extraordinary bull phase. The developed world did not join the party until March this year. On the 4th August, Shanghai B peaked at 224.06, since when it has steadily declined is it possible that China, like the "Grand Old Duke of York" is about to lead world markets back down? Until recently, the model portfolio held a profitable position in the Fidelity China Focus Fund but that was sold on the 5th August and the profits banked. Chinese equities are somewhat lower since.
From early 2008 when it commenced its 75% collapse, one indicator has proved reliable the 8- week moving average. This is the flowing dotted line which you will see on both weekly and daily charts below. Each dot is the average price for the previous 8-weeks. When prices are below the 8- week moving average, the market is falling and when above it is rising. Only by breaking through the moving average can the trend change.

You will see from the daily chart below that on 17th August the price fell below the 8-week moving average. If the price, from here, turns over and falls below the arrowed low of 195.9, expect China's stock market to fall much further.

In spite of the potential fall of Chinese equities, China and emerging markets are the future. They provide more than 50% of global GDP and rising. They are an unstoppable force and will deliver huge investment opportunities for years to come. We look forward to reinvesting in the Chinese stock market, and other emerging markets, as soon as it is appropriate. One way we can assess when that will be is by monitoring the charts relative to the 8-week moving average.
This article was written by Full Circle Asset Management ,as published in the threesixty Newsletter on 28 August 2009
Get the latest financial news, insights and expert analysis from our award-winning MoneyWeek team, to help you understand what really matters when it comes to your finances.
MoneyWeek is written by a team of experienced and award-winning journalists, plus expert columnists. As well as daily digital news and features, MoneyWeek also publishes a weekly magazine, covering investing and personal finance. From share tips, pensions, gold to practical investment tips - we provide a round-up to help you make money and keep it.
-
 ISA fund and trust picks for every type of investor – which could work for you?
Whether you’re an ISA investor seeking reliable returns, looking to add a bit more risk to your portfolio or are new to investing, MoneyWeek asked the experts for funds and investment trusts you could consider in 2026
-
 The most popular fund sectors of 2025 as investor outflows continue
It was another difficult year for fund inflows but there are signs that investors are returning to the financial markets

