Get the latest financial news, insights and expert analysis from our award-winning MoneyWeek team, to help you understand what really matters when it comes to your finances.
You are now subscribed
Your newsletter sign-up was successful
Want to add more newsletters?

Twice daily
MoneyWeek
Get the latest financial news, insights and expert analysis from our award-winning MoneyWeek team, to help you understand what really matters when it comes to your finances.

Four times a week
Look After My Bills
Sign up to our free money-saving newsletter, filled with the latest news and expert advice to help you find the best tips and deals for managing your bills. Start saving today!
The stock market has arrived at a juncture - and it's more critical than many folks might realize.
Let me break it down for you: What happens over the next few days of trading could set the stage for the next one to three months - and maybe more.
The market's reaction to the May 2006 and February 2007 pullbacks was typically full of angst, as emotions ran high and investors scrambled to sell. But it's important to remember that neither pullback was big enough (not greater than 10%) to be called a true correction.
MoneyWeek
Subscribe to MoneyWeek today and get your first six magazine issues absolutely FREE

Sign up to Money Morning
Don't miss the latest investment and personal finances news, market analysis, plus money-saving tips with our free twice-daily newsletter
Don't miss the latest investment and personal finances news, market analysis, plus money-saving tips with our free twice-daily newsletter
The drop we've seen over the last week or so has triggered similar angst, with a growing consensus believing that the credit crunch seems more real this time... that U.S. dollar really is in deep trouble, having received a sound thrashing from most currencies. In short... yes, things could be different this time. Let's see how...
After 5 Years, Is This Market Ready To Really Correct?
It's easy to see why the recent stock market drop has caused such a similar range of emotions. In just six days, the market completely unwound three months worth of hard-fought price gains. The old saying that, 'Markets crawl up the stairs and then jump out the window' was certainly right on the money on this occasion!
So is the market really ready for its first real correction in almost five years? Or will investors shrug off the negativity and propel the market forward once again? The charts reveal that this is a critical point...
Market Memory - More Than a Passing Fancy
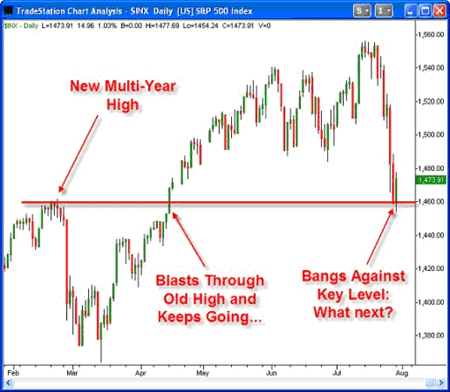
If you're looking for a critical area on the S&P 500 index, then cast your eyes towards the 1,460 area. On the chart below, you'll see three important times when this zone has proved very important.

So let's trace back the S&P's three 1,460 points:
1. As you can see, the first time the index hit 1,460 was in February 2007 - a multi-year high that occurred just before the February 27 drop.
2. In April, the index broke through this resistance level and powered upward for three months to all-time highs.
3. This is where the index is now - trading around this important area again.
But there's one more important piece to this puzzle...
The Fibonacci Retracement Proves Important... Again
In past articles, we've shown how investors use Fibonacci retracement points to calculate potential reaction areas.
Simply put, Leonardo Fibonacci was an Italian mathematician who devised a distinct sequence of numbers. When applied to investing, it states that a market/stock will 'retrace' an upward/downward move by three main amounts - 38%, 50% and 62% (you can get more information on Fibonacci retracements in today's 'Related Articles' section).
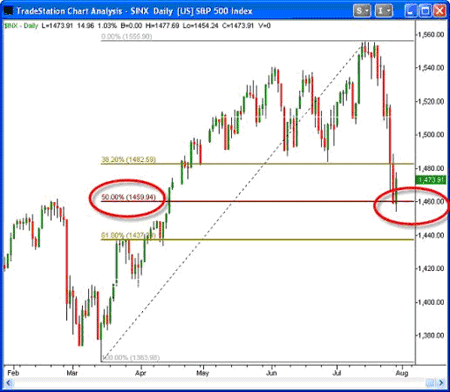
In the chart below, I've drawn a Fibonacci retracement from the March 2007 lows to the July highs. And it comes as no surprise that the 50% retracement from this last market move takes us exactly to that crucial 1,460 level.

This highlights how important the 1,460 area is. And here's why: On Tuesday and Wednesday this week, the index closed at 1,455.27 and 1,451.59 respectively on higher volume.
Because this is under the 1,460 mark by a notable amount, it could now pave the way for the index to re-test the March low and puts an honest 10% correction into play.
If however this retracement is all the downside that the market can muster for now, then look for the all-time highs to be challenged again over the next 4-12 weeks.
So this is no time to panic or go value shopping just yet. Give the market some time to adequately test this important support level. We'll then have a much better idea which direction the market will take next.
By D.R. Barton, Jr., Quantitative Analyst, Mt. Vernon Research for the Smart Profits e-Report, www.smartprofitsreport.com
Get the latest financial news, insights and expert analysis from our award-winning MoneyWeek team, to help you understand what really matters when it comes to your finances.
MoneyWeek is written by a team of experienced and award-winning journalists, plus expert columnists. As well as daily digital news and features, MoneyWeek also publishes a weekly magazine, covering investing and personal finance. From share tips, pensions, gold to practical investment tips - we provide a round-up to help you make money and keep it.
-
 Pitch to Portfolio: Lioness Jill Scott's investing game plan
Podcast After bringing football home as a Lioness, Jill Scott discusses how she transformed her finances and became an investor in this latest episode of MoneyWeek Talks.
-
 UK unemployment hits highest level since 2021 – will interest rate cuts follow?
UK unemployment reached its highest rate in almost five years by the end of 2025. Is AI to blame and will the Bank of England step in with an interest rate cut in March?

