Is it time to buy again?
How is the credit crisis affecting the stockmarket? James Ferguson looks at the shares that could weather the storm best, and what you need to know before buying.
Get the latest financial news, insights and expert analysis from our award-winning MoneyWeek team, to help you understand what really matters when it comes to your finances.
You are now subscribed
Your newsletter sign-up was successful
Want to add more newsletters?

Twice daily
MoneyWeek
Get the latest financial news, insights and expert analysis from our award-winning MoneyWeek team, to help you understand what really matters when it comes to your finances.

Four times a week
Look After My Bills
Sign up to our free money-saving newsletter, filled with the latest news and expert advice to help you find the best tips and deals for managing your bills. Start saving today!
It's been ten months since the credit crisis reared its head. One bank nationalisation and two huge rights issues later, is there light at the end of the tunnel? The stockmarket seems to think so, with the FTSE 100 reversing over half its losses to date. But surely we can't be out of the woods yet? Well, it's not quite that simple. The worst is certainly still ahead for the economy. But there are signs that we may have seen the bottom for the stock- market. I'll explain why in a moment.
The economy is in trouble
One thing's for sure: the economy has much further to fall. The manufacturing segment of the American labour market has been negative for two years now, but the service sector has been keeping total jobs growth positive (just). The service jobs data' are estimated by extrapolation and only corrected months later. This is fine normally, but unreliable at turning points.
Households certainly don't like the look of the jobs situation. The number of American consumers claiming jobs are hard to get' is at a four-year high; inflation expectations are at an 18-year high; credit is harder to get than at any time since the early 1990s; and consumer confidence is at an almost 15-year low. Throw in house prices falling at a double-digit rate and it's clear that upcoming tax rebates have a lot of work to do if they are to boost the economy.
MoneyWeek
Subscribe to MoneyWeek today and get your first six magazine issues absolutely FREE

Sign up to Money Morning
Don't miss the latest investment and personal finances news, market analysis, plus money-saving tips with our free twice-daily newsletter
Don't miss the latest investment and personal finances news, market analysis, plus money-saving tips with our free twice-daily newsletter
The vicious feedback loops that characterise recessions are just beginning. American car sales are falling off a cliff. This collapse in demand for discretionary consumer goods leads to inventory build-ups (which we're already seeing), production slowing, lay-offs and cancelled expansion plans, before weaker sales kick the whole cycle off again.
This is bad for banks. As retail sales drop and retail rents fall or default, commercial property defaults rise, along with corporate debt defaults. And it would be amazing if banks don't suffer at least normal charge-offs against consumer credit. Credit card charge-offs, still below the historical average of 5.5%, hit 6.4% in the 1991 recession and 7.1% in 2002. Loan delinquency rates likewise reached 6.3% and 5.5% in the last two recessions, but are still only 5% today.
The reality is that we probably won't come out of the doldrums until America does; and the US won't bottom out until house prices do the unsold housing overhang could take three to five years to shift. There is no prospect of a quick fix. But does that mean doom and gloom for stockmarkets?
Stocks do best when growth is low
Markets are never just a pure play on the economy, or even profit growth. Bond markets positively revel in their contrary relationship to macro-economic news. When the economy weakens, people buy bonds; when it weakens further, they buy more. This is because a weak economy is likely to mean interest-rate cuts. These can be slow in coming, due to the overhang of late-cycle inflation from when times were booming.
But finally, slower demand putting pressure on prices means that inflation gets sucked out of the economy, and lower rates are needed to try and kick-start activity again. Long bond yields, therefore, always fall (bond prices rise) as GDP falters.
You might expect stock prices to fall too, but it's not that straightforward. As Warren Buffett points out, since World War I there have been two distinct periods of strong US stockmarket growth and two doldrums. The dead markets coincided with the strong economic growth periods between the wars and between 1966 and 1982, when nominal GDP growth averaged about 10%. The strong stockmarket growth periods were 1950-1966 and 1982 to date, when nominal GDP growth was nearer 5%. Lower growth, at least nominally, usually means stronger stockmarkets because shares are at least partly driven by interest rates.
Why interest rates matter
The way that shares are driven by interest rates can be seen by comparing bond yields with dividend yields. Over time, firms reinvest at least half of all earnings for future growth and pay about 40% out as dividends. In 1961, Nobel Laureates Franco Modigliani and Merton Miller argued that dividends were irrelevant. A rational investor shouldn't care whether he gets paid the cash, or whether the company reinvests on his behalf. Rationally, companies would not reinvest in schemes that would not at least match returns available elsewhere.
Dividend yields over the last 25 years have averaged about 35% of ten-year Treasury yields in the US; a bit lower for the German DAX dividends against bunds; and a bit higher for the FTSE 100 dividends versus gilts. Here's our first anomaly. Right now, US dividends on the S&P 500 yield about 55% as much as Treasuries (50%-60% more than normal). The FTSE 100 is paying out 80% as much as gilts, as is the DAX, while the average dividend yield in Japan's TOPIX matches the yield on the ten-year JGB bond. The only other time we've seen such high ratios in the last 25 years was early 2003 just before global markets began their post-dotcom bull run.
So are stocks cheap?
The S&P price/earnings ratio (p/e ratio) is now 14 times, well down from the dotcom peak of 25 times. But it is still double the 1982 low of seven times and is at the same level it hit in the summer of 1987, just before the October crash. The FTSE 100's p/e is lower, at around 11 times, but again not as low as it was in the early 1980s, or even the late 1980s.
But if the S&P can crash in 1987 when the p/e is 14 times, but not peak in 2000 until the p/e reaches almost 25 times, then a p/e ratio on its own clearly can't help us. We need to know what drives the p/e multiple and to what we should compare it.
Since Modigliani and Miller argued that dividends were irrelevant, stockmarket strategists can assume for the sake of comparison that all earnings are paid out in dividends. So stocks yield' whatever their earnings are. An earnings yield is just the inverse of the p/e and it makes shares directly comparable with alternative assets such as bonds.
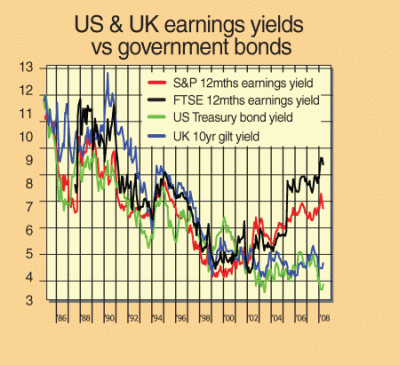
For 20 years, until about mid-2004, it was hard to see much daylight between the earnings yields of the S&P (see the chart below) and the FTSE 100, or between those stockmarkets and their respective ten-year government bond yields. But since 2005 they have diverged.

Both the FTSE 100 (earnings yield 9%) and the US S&P 500 (earnings yield 7%) are yielding double their respective bond markets (gilts yield 4.5%, Treasuries yield 3.5%). Over time, bond yields can never stray far from nominal GDP growth, and profits shouldn't consistently stray far from economic growth. So there are only three ways to resolve this. Earnings have to halve, stock prices double, bond yields double, or some combination of the three.
Will earnings halve?
The most obvious, and some would say most likely, event is that earnings halve. We're on the cusp of a recession in the UK and probably already in one in the US. So what size of earnings hit is normal' for a recession? In 1991, the US, fiscally bolstered by the first Iraq War, only saw S&P earnings per share (EPS) fall 8% on a 12-month analyst consensus basis. Yet Japan, just entering a deflationary spiral, saw profits cut by more than half.
A better guide to normality' is Britain, where EPS fell 23% peak-to-trough over 1990-1992; and Germany, which saw earnings fall 40% (but only really from late 1992 into 1993). In the dotcom bust, US EPS fell 19%. Britain's less diversified economy took a bigger hit, with earnings falling 35%; as did Germany's EPS. Japan saw a 30% dent to EPS. In all, over the last two recessions, the G4 took an average earnings hit of 31%.
So, with the exception of banks where rights issues and other capital raising will trigger huge dilution, EPS is unlikely to fall 50%, or even 40%. A good worst-case assumption is that earnings will fall about 30% in a full-blown recession. This suggests stockmarkets are too bearish, discounting earnings yields by up to double the yields on government bonds. Either bonds have to fall more or share prices eventually have to rise. Still, if earnings fall that much over the next year or two, how can any market survive unscathed, let alone expect to go up?
A tale of two recessions
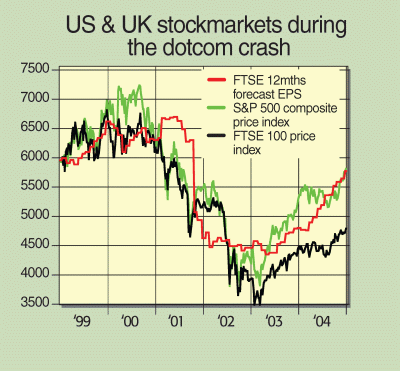
Well, surprisingly, it has happened and not that long ago. In the dotcom crash, shares in the UK and America started falling in 2000 (see the chart below), ahead of the earnings growth outlook, which held up until 2001. Ultimately, share prices fell just as much (if not more than) as earnings and didn't start rising until EPS growth levelled off.

But this obscures several key facts. When shares peaked in 2000, valuations were very high. P/e ratios were a threatening 25 times, an earnings yield of only 4%. A normal' 30% drop in EPS would bring the earnings yield down to a miserly 2.8%. Government bonds yielded over 6.5% in America in early 2000 and dived to nearly 3% by 2003. That might have been enough to correct the valuation imbalance, but the S&P was falling too, from 1,500 to almost 800. That was overkill. By early 2003, because share prices had fallen faster than earnings, the S&P earnings yield had risen to 7%, meaning shares were deeply undervalued. Throw in an earnings recovery from 2003 and the scene was set for a huge rally.
But that huge rally never really appeared. The dotcom crash scared investors out of stocks and into property. House prices, ever a function of the availability and cost of credit, doubled. For institutions, the equivalent assets were commercial property and (indirectly) highly leveraged hedge funds and private equity. So while share prices have risen, earnings multiples have shrunk. Since those stockmarket lows in 2003, the S&P p/e ratio has fallen from 17 times to 14 times. The re-rating of the FTSE 100 has been even more extreme, with the p/e down from 19 times to 11 times. Dividend yields too have risen, not fallen, meaning stocks have been getting cheaper as they have risen.
Stocks were also cheap by all accounts going into the 1991 recession (the p/e was ten times, the dividend yield 5.5%). Then, as it does today, the UK faced a consumer recession due to falling house prices and a banking system looking close to collapse (Barclays and Salomon Brothers ran into trouble, while Drexel Burnham Lambert, Continental Illinois, the New York Savings Bank and the State Bank of New South Wales went under). But the FTSE 100 didn't track earnings forecasts down beyond the first six months. By early 1991, the market turned north, tracking the S&P up in pretty much a straight line for the next decade.
Why? The first answer is that stocks were cheap. Today, memories of the dotcom fiasco are still fresh. The same was true back in 1991 only four years earlier, investors' confidence had been shaken by the 1987 crash. And like today, retail investors had bet on house prices, spurred by excessive bank lending and lax credit controls. House prices fell for six straight years in 1990-1996, but over the same period the FTSE 100 gained 70%.
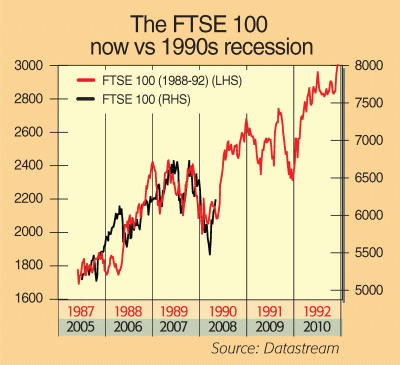
Could something similar be happening today? In the chart below I've superimposed the FTSE 100 from the last three years over the FTSE 100 from 1988-1993. It does suggest that if we are to see a replay of the 1991 recession, and even if, like then, G4 earnings fall around 30%, this may not actually be a smart time to be selling. We could even see these cheap developed world stockmarkets rising.

So don't buy right now...
I still believe investors will get a chance to buy in lower. There's evidence that this latest rally is running out of steam. The vital up' day was last Friday, when traders were willing to close out short positions ahead of the long weekend. They may well sell short again soon. The market is like a swimmer pushing through heavy surf towards calmer waters beyond. We know the waves are coming and we're pretty sure we can hold our course, but there are bound to be some big breakers along the way.
My advice is to buy big, blue-chip stocks (not banks) with strong balance sheets, high dividend yields and good prospects for dividend growth (see my tips below). But buy them when the press is gloomy after a sell-off and discussing how low the market may go, not when everyone is hoping for the bull's return. It's coming but we've got some heavy wading to get through first.
Three stocks to bag when the next sell-off comes
It's not quite the right time to buy back into the market I believe we'll see another correction in the very near-term. But when the next sell-off takes place, here are three stocks you should be ready to pounce on. Regular readers will know that I'm a big fan of Royal Dutch Shell (RDSB). The reason to buy this stock is simple. Ultimately, Shell's profits are a function of the oil price. The oil price is incredibly high, and even if it falls sharply from current levels, it will still remain well above consensus City forecasts. That means Shell's profits will remain high too. Yet analysts can't seem to get their head around this fact.
Once again, both Shell and BP trounced City forecasts for their first quarters earlier this month, sending both stocks higher. Yet if you annualise the first quarter, Shell trades on a forward p/e of seven a bargain.
Broadcaster BSkyB (BSY) is another stock unjustly shunned by the City. Third-quarter results showed that all three product lines (Pay TV, broadband and telephony) are doing well with subscriber growth of 56,000, 229,000 and 180,000 respectively. Package upgrades are performing well too, with Sky+, multi-room and HD signing up 262,000, 40,000 and 43,000 extra subscribers respectively. Meanwhile, the rate of turnover of customers at 10.5% was below forecasts.
Average revenue per customer is a very decent £424 a year and cash flow (EBITDA) is more than £1bn. The share price has been doing nothing for nearly five years, but the story goes from strength to strength something's got to give.
Shares in insurer Friends Provident (FP) have tanked after JC Flowers withdrew its low-ball bid approach at 150p. But with an embedded value (basically, the insurance sector equivalent of net asset value) of about 157p, it already looks cheap at the current price of 120p or so. Certainly, business will be slower in Britain as the housing market slides, but this should be offset by the Asian and Middle Eastern units, which grew by more than 150% last year.
The dividend yield is very attractive on around 7%, and on top of that, there will be a return of cash to shareholders after various disposals, which is expected to come in at up to 55p a share.
Get the latest financial news, insights and expert analysis from our award-winning MoneyWeek team, to help you understand what really matters when it comes to your finances.
James Ferguson qualified with an MA (Hons) in economics from Edinburgh University in 1985. For the last 21 years he has had a high-powered career in institutional stock broking, specialising in equities, working for Nomura, Robert Fleming, SBC Warburg, Dresdner Kleinwort Wasserstein and Mitsubishi Securities.
-
 Average UK house price reaches £300,000 for first time, Halifax says
While the average house price has topped £300k, regional disparities still remain, Halifax finds.
-
 Barings Emerging Europe trust bounces back from Russia woes
Barings Emerging Europe trust has added the Middle East and Africa to its mandate, delivering a strong recovery, says Max King