The charts that matter: markets hold their breath
The yield curve suggested a recession was on the way when it inverted – but that could be up to two years away. John Stepek looks at the charts that matter most to investors to see which way the markets are turning.

Get the latest financial news, insights and expert analysis from our award-winning MoneyWeek team, to help you understand what really matters when it comes to your finances.
You are now subscribed
Your newsletter sign-up was successful
Want to add more newsletters?

Twice daily
MoneyWeek
Get the latest financial news, insights and expert analysis from our award-winning MoneyWeek team, to help you understand what really matters when it comes to your finances.

Four times a week
Look After My Bills
Sign up to our free money-saving newsletter, filled with the latest news and expert advice to help you find the best tips and deals for managing your bills. Start saving today!
Welcome back. I've been in Edinburgh this week at Merryn's Adam Smith show we had some fascinating conversations. The run is pretty much sold out now, but you might still get tickets for tomorrow's final show if you're quick.
And make sure you don't miss our Wealth Summit in November. It's going to be a very full day, packed with practical information and deep insights into the unprecedented monetary backdrop, and changing political environment we're all trying to navigate. If you are looking to grow and protect your wealth in the coming years, don't miss it.
If you missed any of this week's Money Mornings, here are the links you need:
MoneyWeek
Subscribe to MoneyWeek today and get your first six magazine issues absolutely FREE

Sign up to Money Morning
Don't miss the latest investment and personal finances news, market analysis, plus money-saving tips with our free twice-daily newsletter
Don't miss the latest investment and personal finances news, market analysis, plus money-saving tips with our free twice-daily newsletter
Monday: If this company manages to go public, it just has to mark the top of the market
Tuesday: Are we about to see an epic splurge of government spending?
Wednesday: How the success of the Edinburgh Fringe proves that Adam Smith was right
Thursday: It's getting harder and harder for central banks to bail us out
Friday / Currency Corner: This trend looks very promising for the Canadian dollar
Subscribe: Get your first 12 issues of MoneyWeek for £12
And if you haven't read my book, The Sceptical Investor, and you want to know more about contrarian investing and cycles in general, you can buy it here. (And if you have read it, please leave an Amazon review if you have time.)
On to the charts. The yield curve is not currently inverted, but it's very, very flat indeed. (If you need a reminder about why the yield curve matters, then here you go.)
In short, when the gap between the yield on the ten-year US government bond and the yield on the two-year turns negative (so that it costs the US government less to borrow for ten years than for two), then it's a pretty reliable indicator that a recession is coming our way.
That said, it could be up to two years before it gets here, judging by the past, and we only have a small sample size to draw on, so as usual with finance nothing is set in stone.
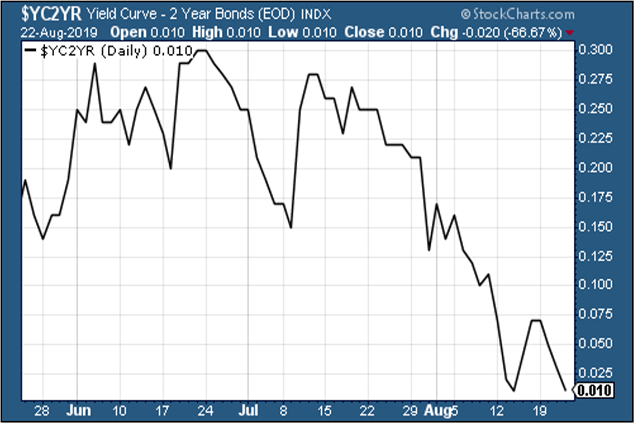
(The gap between the yield on the ten-year US Treasury and that on the two-year, going back three months)
Gold (measured in dollar terms) has been consolidating after its recent rampage higher. It's amazing how quickly an asset can go from being overly detested to perhaps a little-too-loved almost overnight.
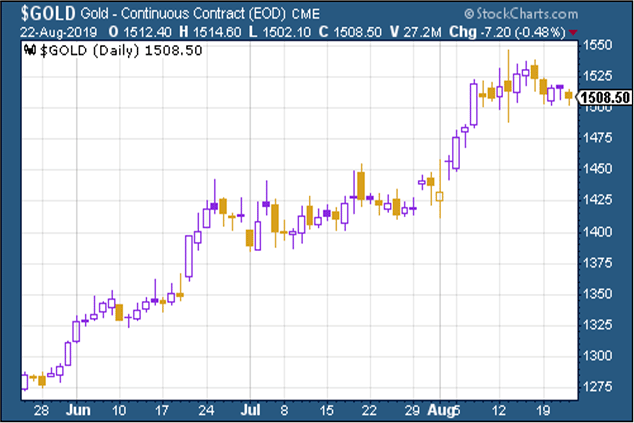
(Gold: three months)
The US dollar index a measure of the strength of the dollar against a basket of the currencies of its major trading partners was little changed this week. The dollar's ongoing strength is perhaps the biggest stress point for the wider markets (a strong US dollar is not usually great news for asset prices).
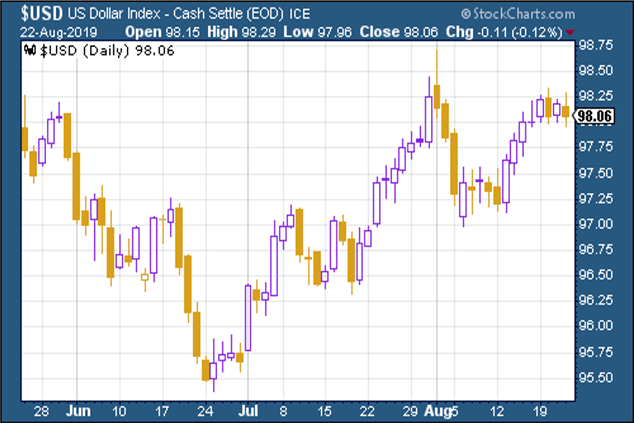
(DXY: three months)
Meanwhile, the number of Chinese yuan (or renminbi) you can get to the US dollar (USDCNY) hit its highest level in 11-years, with the currency remaining firmly on the weak side of the 7.0 level that everyone had viewed as a line in the sand until recently.
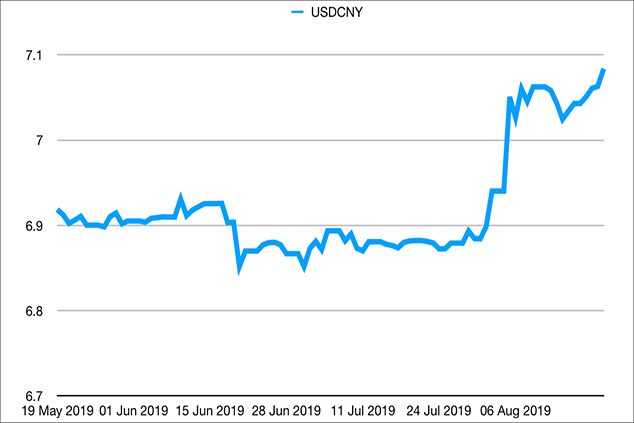
(Chinese yuan to the US dollar: three months)
As for ten-year yields on major developed-market bonds the US market rebounded somewhat this week though it could simply be a respite rally given the sheer depths they have plumbed recently. Below, the US ten-year Treasury yield.
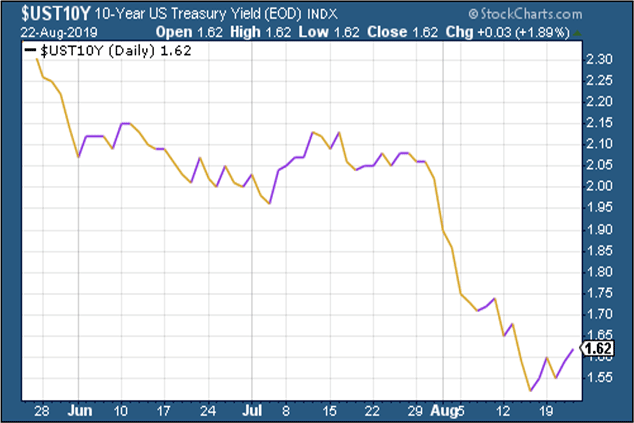
(Ten-year US Treasury yield: three months)
But Japan went even deeper into negative territory:
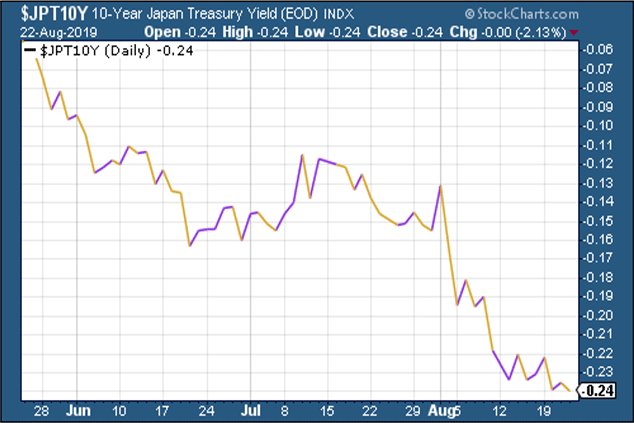
(Ten-year Japanese government bond yield: three months)
Germany also rebounded a little, but remains heavily negative. Hopes that the German government might loosen the purse strings at some point probably accounted for the bounce.
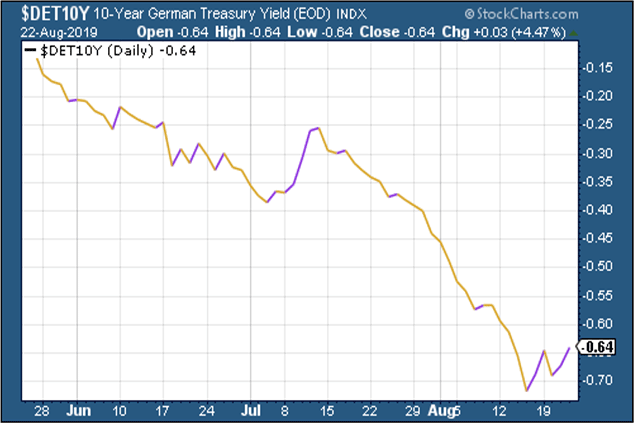
(Ten-year bund yield: three months)
Copper slipped back as concerns about recession continue to dominate.
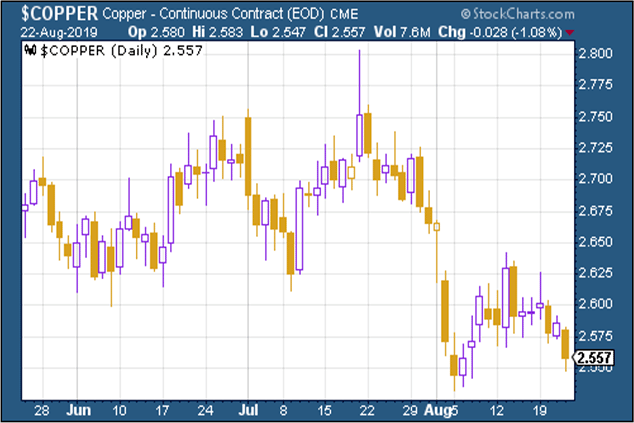
(Copper: three months)
The Aussie dollar traded in a narrow range.
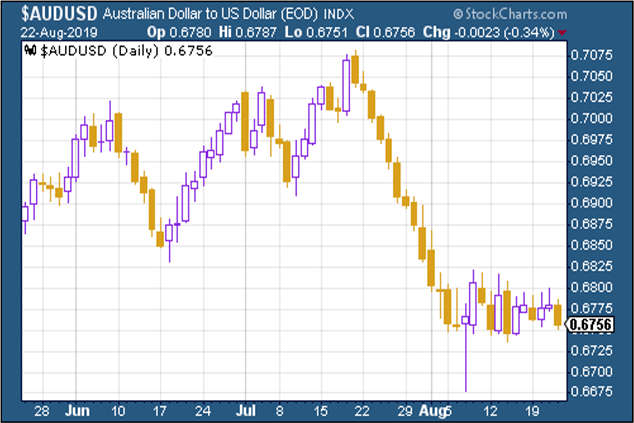
(Aussie dollar vs US dollar exchange rate: three months)
Cryptocurrency bitcoin was little changed on the week, trading around the $10,000 mark.
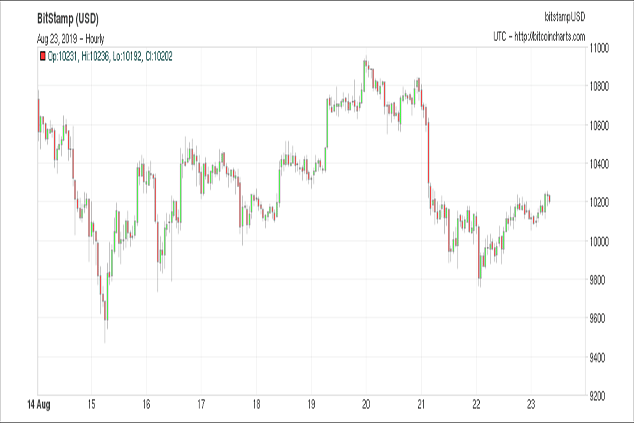
(Bitcoin: ten days)
US weekly jobless claims came in lower than expected at 209,000. The four-week moving average edged higher to 214,500.
US stocks typically don't peak until after this four-week moving average has hit a low for the cycle, and a recession tends to follow about a year later (remember that this again, is from a tiny sample size, originally highlighted by David Rosenberg at Gluskin Sheff).
The last low came about three months ago, at around 201,000. Is another trough likely? It certainly shouldn't be written off but equally, a peak three months ago would tie in with the gloomier outlook suggested by the recent yield curve inversion. We can only watch and wait.
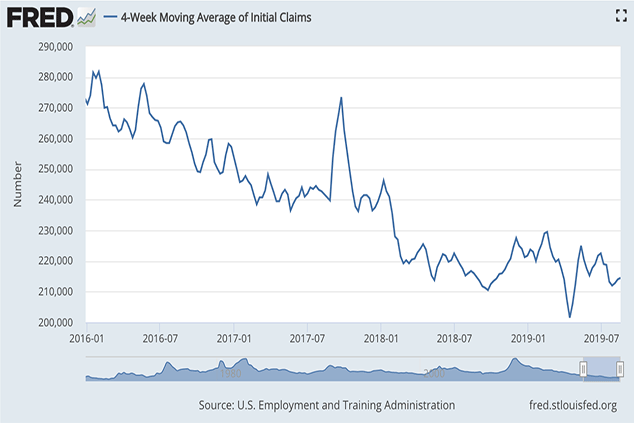
(US jobless claims, four-week moving average: since January 2016)
The oil price (as measured by Brent crude, the international/European benchmark) rallied a little this week.
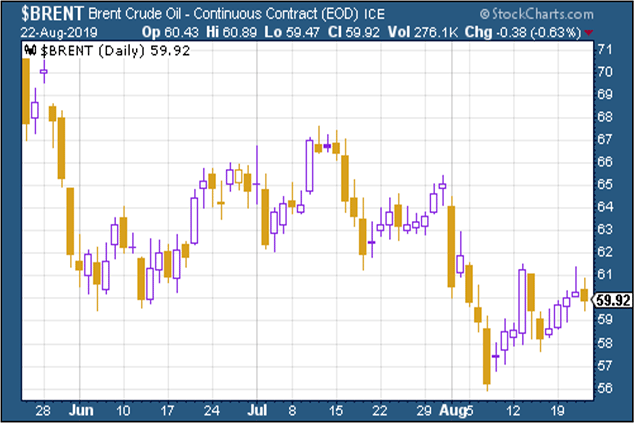
(Brent crude oil: three months)
Internet giant Amazon bounced a little this week, along with the wider market.
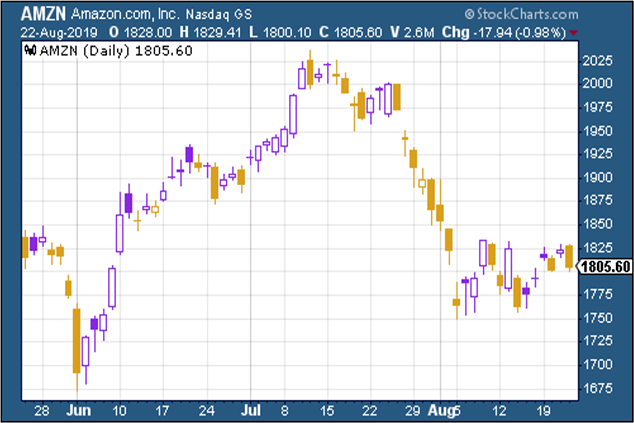
(Amazon: three months)
Electric car group Tesla did likewise.
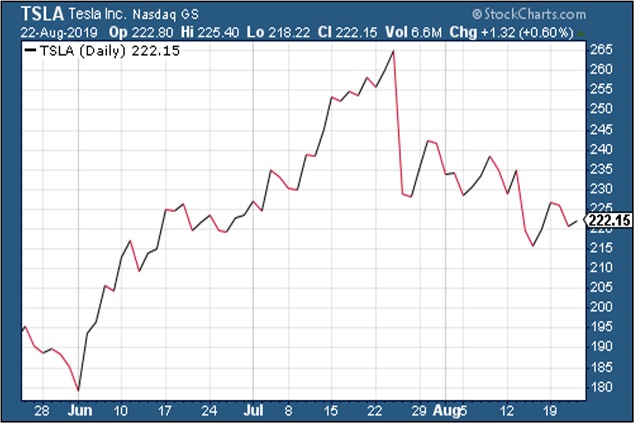
(Tesla: three months)
Get the latest financial news, insights and expert analysis from our award-winning MoneyWeek team, to help you understand what really matters when it comes to your finances.

-
 Barings Emerging Europe trust bounces back from Russia woes
Barings Emerging Europe trust has added the Middle East and Africa to its mandate, delivering a strong recovery, says Max King
-
 How a dovish Federal Reserve could affect you
Trump’s pick for the US Federal Reserve is not so much of a yes-man as his rival, but interest rates will still come down quickly, says Cris Sholto Heaton