Get the latest financial news, insights and expert analysis from our award-winning MoneyWeek team, to help you understand what really matters when it comes to your finances.
You are now subscribed
Your newsletter sign-up was successful
Want to add more newsletters?

Twice daily
MoneyWeek
Get the latest financial news, insights and expert analysis from our award-winning MoneyWeek team, to help you understand what really matters when it comes to your finances.

Four times a week
Look After My Bills
Sign up to our free money-saving newsletter, filled with the latest news and expert advice to help you find the best tips and deals for managing your bills. Start saving today!
First published on 31/07/08
It's ten working days since the July stock market lows, a result of the Fed rescuing Fanny Mae and Freddie Mac.
So far, as can be seen by the one year charts of FTSE100, S&P500 and Dow Jones Euro Stoxx 50, what has transpired at a short-term oversold position is consolidation and a 1/3rd retracement of the total decline from May. Note the consolidation that is taking place at the January and March 2008 lows.
MoneyWeek
Subscribe to MoneyWeek today and get your first six magazine issues absolutely FREE

Sign up to Money Morning
Don't miss the latest investment and personal finances news, market analysis, plus money-saving tips with our free twice-daily newsletter
Don't miss the latest investment and personal finances news, market analysis, plus money-saving tips with our free twice-daily newsletter
This leads us to only one conclusion, the long term primary bear market is well and truly in charge and that will remain the case all the time prices remain below the 30-week moving average.
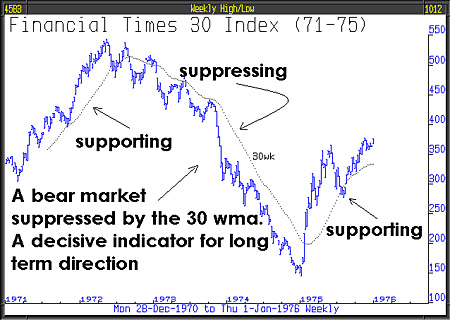
The 30-week moving average is the dotted line, each dot represents the average price of the previous 30 weeks, the dots create a flowing line which, in bull markets, tends to support the ongoing price action and in bear markets suppress it.
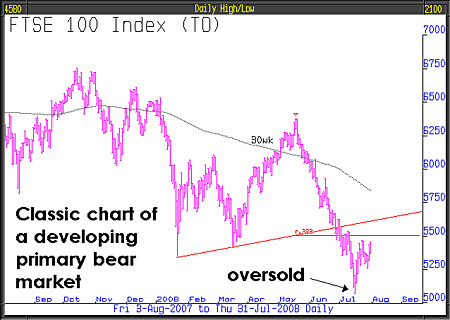
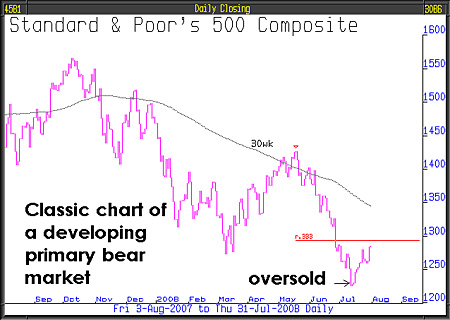
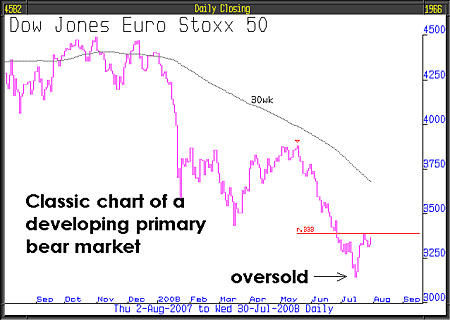
You will see exactly what we mean by examining the 5-year weekly chart of the primary bear market for UK equities from 1972 to 1975. Each bear market rally during that period returned to, and then failed at, the 30-week moving average and then moved lower. It is also what happened in May this year.
If, because we repeat it every two weeks, you skipped the first paragraph of this section, go back and read it because importantly it encapsulates the reality of what is going on. The credit contraction, following the wildest credit expansion ever, will continue to undermine the banking system as the banks themselves, by restricting credit, reduce economic activity and so further undermine asset values. Involuntarily banks are creating the very economic conditions that make markets and their own financial situation worse.
For the bear market to make new twelve month lows there probably needs to be a trigger event, because much of the bad news is already priced in. More likely than not, the market will need something quite unexpected or news that's worse than expected. An example of this might happen on Friday this week when the latest US non-farm payrolls numbers are published. Analysts are expecting a negative number of around 75,000. If it is much worse than that, the markets will probably fall significantly. If it comes in better, expect another rally.
In issue number 574, two issues ago, dated 3rd July, we published a chart headlined The Implications of "Wealth-Growth Regimes" for today's Asset Allocation Problem' it was from an essay by Woody Brock of Strategic Economic Decisions Inc. www.sedinc.com. Woody is an independent economist retained by us. The chart focused on the mean-reverting dynamics of US household net worth, it also has implications for the UK, because of the similarity of the UK economy to the US economy, and anyway, if things are going to be really grim in the US, they are not going to be any good here. The essay that contained this chart was published in June and entitled, The Generalised Asset Allocation Problem'. It is a must read for anybody who wishes to have a deeper understanding of the times we are now in. The following is an extract from it
"As we have stressed many times in these pages, one of the most important, if rarely discussed, constraints upon overall investment performance stems from mean reversion in the growth of a nation's net worth. More specifically, at a macro level of analysis, long-run average wealth growth equals GDP growth. At a micro level, per capita wealth growth equals productivity growth. This is the ultimate "no free lunch" theorem proved within that branch of economics known as growth theory."
The forces at work here are massive and, like nature itself, are unchallengeable.
The consequences, in investment terms, are that direct or indirect stock market, long only, investment will continue to be very precarious and likely to savagely damage existing wealth. Investment success will only be possible by investing in those assets that are inversely correlated with stock markets. A good example of this is the SocGen Bear Accelerator.
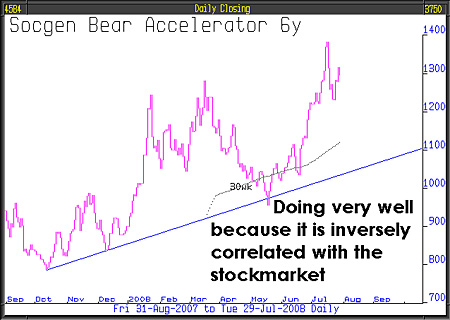
Certain sectors of the stock market and certain specific geographical regions will, in due course, offer new opportunities. Part of our work is to monitor all of the world's stock markets and sectors to identify those areas that, for good fundamental reasons, can benefit; even when stock markets in the developed world, excluding Japan, are in disarray.
Important clues, going forward, will be found in the house market crisis. Lessons from history are important especially if those lessons are supported by personal experience.
The credit contraction driving this latest housing downturn is the worst of any that we have previously experienced. Prior to now, the worst had been in the 1970s.
Looking back at the 1970s gives an insight into what might happen today. Then, when purchasers applied for a mortgage, we would advise them to insure the property for more than it cost to buy it. Initially this may have seemed illogical because the purchase price included land. However, this is how severe it was then - houses were being sold for less than it cost to build them. I remember telling buyers, then, that they were "Buying the house for than less than it cost to build and the land was thrown in free."
If, as we believe, the developing economic conditions today are worse than they were then. And the credit expansion that ended last year was more insane than the credit expansion that preceded the 1970s slump. Then to get some idea of where the property market could go, consider today's rebuilding cost of your house, knock off 10%, and you have an idea of the scale of the problem and why houses are not selling at today's prices.
Clearly house prices are set to go much lower yet. The impact on the economy and on the banking system will be massive.
In the last two weeks the housing market news has got worse. The FT said that Britons expect house prices to keep falling. From the Daily Telegraph; estate agents say that eight out of ten homes on their books won't sell. They say it is because many potential buyers can't get mortgages and also because 74% of houses on their books are very overpriced.
Because sellers' prices are so far above the price potential buyers are willing to pay, and the availability of the finances so limited, there are not enough transactions to price the market properly. This week the Bank of England reported that in June there were only 36,000 mortgages for house purchase, steeply down from May when there were 41,000, and an incredible 69% below the level of a year ago. The lowest comparable data since it was first published in 1993.
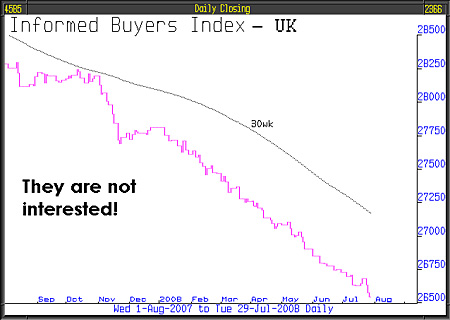
The fragile optimism that supports the current bear market rally is not shared by long term investors, instead activity is predominantly driven by short term speculation. Lowry's index of selling pressure for the US stock market made a new all-time high this week, this clearly demonstrates that the informed buyers are selling into the rally, not buying it. Below is the chart of a UK Informed Buyers' Index produced by Investment Data Services which further underlines this key truth.
By John Robson & Andrew Selsby at Full Circle Asset Management, as published in the threesixty Newsletter.
Get the latest financial news, insights and expert analysis from our award-winning MoneyWeek team, to help you understand what really matters when it comes to your finances.
MoneyWeek is written by a team of experienced and award-winning journalists, plus expert columnists. As well as daily digital news and features, MoneyWeek also publishes a weekly magazine, covering investing and personal finance. From share tips, pensions, gold to practical investment tips - we provide a round-up to help you make money and keep it.
-
 UK interest rates live: experts expect MPC to hold rates
The Bank of England’s Monetary Policy Committee (MPC) meets today to decide UK interest rates. The last meeting resulted in a cut, but experts think there is little chance of interest rates falling today.
-
 MoneyWeek Talks: The funds to choose in 2026
Podcast Fidelity's Tom Stevenson reveals his top three funds for 2026 for your ISA or self-invested personal pension

