Boom times are here again
Why so gloomy? Understand the business cycle and you’ll see we’re just at the start of the next big boom, say Akhil Patel and Phil Anderson.
Get the latest financial news, insights and expert analysis from our award-winning MoneyWeek team, to help you understand what really matters when it comes to your finances.
You are now subscribed
Your newsletter sign-up was successful
Want to add more newsletters?

Twice daily
MoneyWeek
Get the latest financial news, insights and expert analysis from our award-winning MoneyWeek team, to help you understand what really matters when it comes to your finances.

Four times a week
Look After My Bills
Sign up to our free money-saving newsletter, filled with the latest news and expert advice to help you find the best tips and deals for managing your bills. Start saving today!

In October2008, the month after Lehman Brothers collapsed, Phil Anderson wrote about the key role that land prices play in the economic cycle for MoneyWeek.
Markets were in a panic. That month, the Vix (the market volatility gauge known as the fear index') peaked at 96.4 that's twice the level seen in the wake of the terrorist attacks in September 2001. It looked as though the world or the financial part of it at least would end.
But Phil pointed out that we'd been here before. Based on past cycles, he argued that property prices would keep falling until roughly 2011, then start to recover. He also noted that this recovery would be anticipated by US stock markets starting to rally in 2009/2010.
MoneyWeek
Subscribe to MoneyWeek today and get your first six magazine issues absolutely FREE

Sign up to Money Morning
Don't miss the latest investment and personal finances news, market analysis, plus money-saving tips with our free twice-daily newsletter
Don't miss the latest investment and personal finances news, market analysis, plus money-saving tips with our free twice-daily newsletter
Six years on from that article, we can see that this is pretty much exactly what happened. In real' terms (adjusted for inflation), UK house prices fell by around 25% between 2007 and 2011.
Stock markets, meanwhile, lost around 50% of their value in the crash, but started to recover in 2009 and are now near (or in the case of America, back above) their all-time highs.
Phil's prescience was based on an understanding of the business cycle, and the critical role that the property market plays in boom and bust. By observing how these cycles have played out in the past, we can get a good idea of what might happen in the future.
Here, we explain how the cycle typically works, then look at where we are now and why, based on this, we think the best of the current bull market is still to come.
Boom and bust never ends
Looking at history, we can see that since at least the late-18th century, economies have moved in a rough 18-20 year rhythm of expansion followed by depressed activity.
For example, in the UK the Lawson boom' of the late 1980s (so called as Nigel Lawson was chancellor at the time) gave way to the recession and property crash of the early 1990s.
Roughly 18 years prior to this boom,UK property prices had peaked in the early 1970s, before the start of a credit crunch' in 1973. And roughly 18 years after the Lawson bust, we saw the collapse of 2008.
This cycle of boom and bust is driven by real-estate speculation. Economic growth leads to higher real-estate prices as demand for property (from expanding businesses and flush households) grows. This increase in property prices is ultimately driven by land values: a house costs much the same to build, in terms of labour and materials, regardless of where you build it it's the location that makes the difference to the value.
Today's property investors understand this as locational value', but the technical term is economic rent'. This idea was first articulated by economist David Ricardo in the early 19th century (see below for more on the role of land in boom and bust).
The desire to capture this economicrent' induces ever-more construction activity and speculation on land,fuelled by bank lending. As the good times continue, more and more investments are made based on jam tomorrow' hopes of future capital growth, rather than the jam today' of a decent rental yield.
A property crash ensues as developers and banks over-reach themselves. Falling land prices then damages the banks, which lent too much money against land during the boom times and, with their balance sheets in tatters, lending dries up. As credit is sucked out of the economy and building activity collapses, recession or even depression is the result.
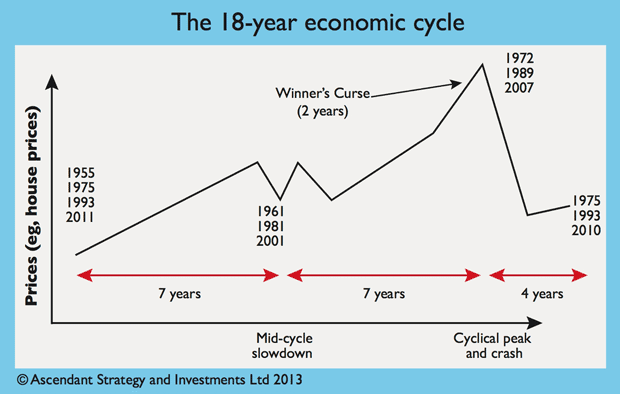
But while it takes several years for the bad debts to be cleared, economies eventually recover. On average (and with surprisingly little variance) the expansion lasts for around 14 years and the crash and recovery for four years.
The cycle is very simple so much so that you might wonder why it's not more widely recognised. But because the role of land in an economy has been virtually airbrushed from economics textbooks, most economists cannot see it.
What time is it?
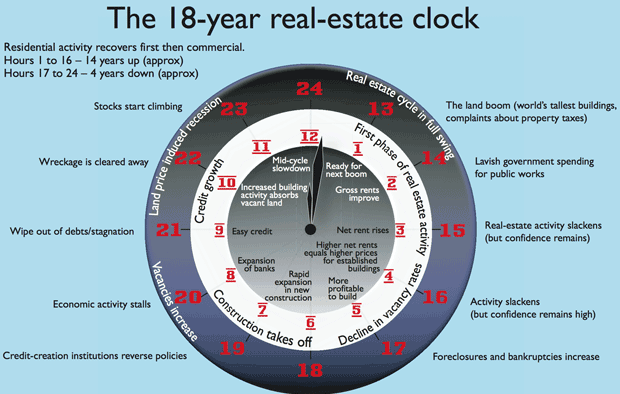
We've represented this 18-year cycle in the form of a 24-hour clock face. If you look at it, you'll see that events since the crash have proceeded in the order described. First, following the crash (around 1:00 to 2:00 on the clock), rents rise.

This seems counter-intuitive the economy is a mess, how can people afford higher rents? But the weak economy, rising unemployment and lack of credit availability also means most people can't buy property, driving them back to the rental market.
Over time, higher rents push up prices for established buildings. In turn, that makes it attractive to start new projects. Once that happens, the developers are back in business.
As you walk around central London today, all around are cranes and building sites testament to the fact that the recovery is under way. In London alone, around 230 tall towers (mostly residential) are planned in the coming years.
And this is just the beginning. By our reckoning, we are at about 6:00 on the real-estate clock. That means we're still near the early stages of this recovery and new boom.
As ever, recovery has taken place against a backdrop of governments doing all they can to preserve the status quo; supporting property prices and the ability of banks to continue to create credit. Just look at Britain's budget speeches and general economic policy in recent years a veritable wish list for all affected vested interests.
We've seen record lows in interest rates, government bail-outs of the banks, and schemes to stimulate house purchases and lending (Help to Buy being just one of many). All to prop up asset prices and keep the system running along.
Stock markets as is the way have responded more quickly than property prices. Importantly and this is perhaps the hardest thing for non-traders to grasp the economic news can often continue to get worse, but markets still recover. That's because the bad news is priced in, and markets start making higher lows.
This is what has happened over the past five years. Markets bottomed in 2009. Since then the FTSE 100 has almost doubled. Other markets have seen even greater gains, particularly the technology-focused Nasdaq index, which has trebled.
There has rarely been a cycle in history when markets do not eventually go higher than the highs established in the prior cycle. The precise point at which this happens can be a clue to the strength of the cycle to come.
What's next?
We expect to see 14 years of economic growth and rising property prices, followed by four years of falling prices. The 14-year expansion phase usually consists of two seven-year halves, interrupted by a mid-cycle slowdown.
Stock markets also fit within this cycle, in that the start is always marked by a major generational' low, and the peak by an equivalent high. A stylised diagram of how property prices move during the cycle is shown above.
Given what we have already said about where we are in the cycle, make no mistake things are looking up here. The next phase will be the normalisation of central-bank monetary policy.
This topic has already drawn a lot of attention over the past year, and will continue to do so. The bears think this will be the point at which everything starts to unravel. But they will be wrong.
While monetary policy will tighten, banks will also start lending more vigorously into the economy (in other words, businesses and households will find it easier to get credit). That's because higher interest rates will drive the yield curve key to a healthy banking system into more normal territory.
In turn, economic growth and employment will continue to pick up. This process may start relatively soon probably playing out over the next year and into 2016.
In the last cycle, we were here in around 1994. Stock-market investors should note that the 1994 tightening episode in the US induced a short-term correction in world markets. But it only lasted for a few months, after which one of the biggest bull markets of all time began.
This time, Western stock markets may also be hit by problems in emerging economies, some of which are at their respective business-cycle peaks (the last cyclical peak in much of east Asia was in the late 1990s 18 years on from that takes us to 2015/2016).

The normal mid-cycle slowdown will then follow around 2018/19. These tend to be short, followed by a quick recovery, setting the economy up for the speculative boom, characteristic of the cycle's second half.
The biggest bull market in history
We firmly believe that the next cycle will be bigger than even the last one, with more wealth created in the next ten years than in any other equivalent period in history.
Why are we so bullish? Mainly because of the strength and speed of the stock-market recovery so far. When markets hit new all-time highs, as they have in the US and Germany (and nearly in the UK too), this early in the cycle, it's very promising.
If history repeats, we could see the FTSE 100 reach highs of above 12,000 by the end of this cycle.
We can also already see some of the trends that will underpin this bull market: technological innovation; falling energy costs; and the rise of a global middle class with vast collective purchasing power.
At the start of every cycle new firms emerge that give us a clue as to the main driver of the cycle. In the early 1990s, Amazon revolutionised the way we did business by making use of the internet. This time, newly prominent companies are using the computing power available to almost everyone to change how we interact with the world.
This trend is changing everything from manufacturing (via 3D printing) to healthcare (through immersive' technologies that monitor our vital signs) to our personal lives (via social media).
Just as the smartphone that was emerging at the end of the last cycle was inconceivable at the start of it, so the way we work, rest and play will be transformed by the end of the current cycle.
For regions well placed to thrive in this new world, whether via research and development, manufacturing, energy production, or business services, the gains will feed through to property prices.
Time to party
The recovery from the approaching mid-cycle slowdown particularly if it is swift will consign the global financial crisis to history. At that point, we'll be at 13:00 on the real-estate clock. This is when the party really gets going.
The second half of the cycle sees a surge in property prices, helped by loose lending practices. By then a new method of bypassing the banking regulations put in place after the last crash will have been invented and it will seem perfectly rational to its users.
In the three cycles since World War II, the average year-on-year property price rise in the second half of the cycle has been 11.6%. That compares to 5.6% a year in the first half. Property and banking stocks do well in this phase. By the time the peak arrives, it's hard to see where the bad news will come from just as most people didn't see disaster coming in 2007.
Even if some concerns are voiced about excessive consumer spending (often credit-fuelled), surging property prices (always credit-fuelled) and lavish government spending (again, based on credit), the scale of the disruption to come is rarely understood.
The final two years of the cycle are what we call the winner's curse' phase, because anyone who buys property in this period will end up regretting it, as the value of their assets will soon fall below the purchase price.
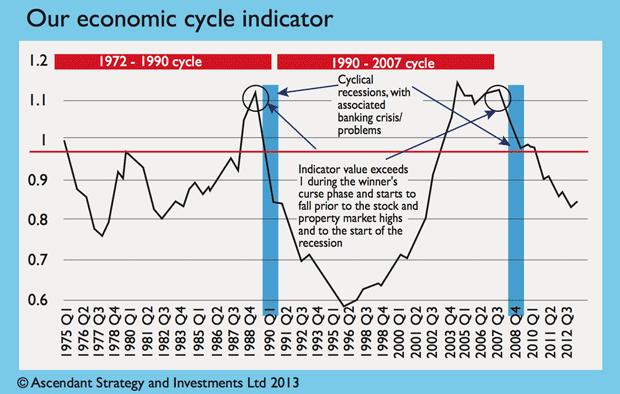
To help with timing decisions, we've developed an economic cycle lead indicator, which is based on changes in land prices relative to changes in GDP.

In past cycles, when this indicator has moved above one and stayed there, the economy has entered the winner's curse' phase. As the indicator peaks, then starts to fall, that's a sign the end-of cycle financial crisis is on its way.
As you can see from the current position of the indicator, the economy should still have plenty of upside. Assuming an 18-year cycle from the last peak, we're looking at 2025/2026 before the next 2008-style collapse.
Other warning signs to watch for near cyclical turns include news of grandiose building projects. Contenders for the world's highest building' tend to open at or just after the peak, having been funded based on optimistic projections of growth, and supported by huge bank loans. One Canada Square in Canary Wharf opened in 1991. Dubai's Burj Khalifa opened in 2010.
Also, by the time we reach 2025, no one in the world under the age of 40 will have much direct memory of the 2008 crash. So it would be no surprise to hear a newly minted 30-something property billionaire declare that property prices will never go down. When you hear that, you'll know what is about to happen.
Meanwhile, investors can profit from the good times to come before the next bust. We look at what this means for various asset classes below.
How the cycle moves asset prices
What does all this mean for asset prices? Here's a road map for different asset classes and the economy for the next decade.
Property
Real estate is what drives the 18-year cycle the gradual recovery from the previous crash eventually leads to excessive speculation fuelled by careless lending, which in turn leads to another crash.
Some might argue that the predictability of this cycle of boom and bust and our failure to learn from it is depressing. But for canny investors, understanding this cycle is the key to profiting from it. And at this stage in this particular cycle, the outlook is bright for property.
By 2018, we expect the market to be humming along nicely, with the woes of 2008 firmly behind us. By 2024, we'll have hit the winner's curse' phase, which is when early investors should be ready to get out of the market it's certainly not the time to take on lots of debt to buy a property.
Then in 2025/2026, we'll see a peak in the property market the latest tallest building in the world' might well open that year followed by a significant crash.
Stocks
Stock-market movements coincide with phases of the cycle. With US and UK markets near, or at, all-time highs so early in the cycle, we can expect the eventual peak to be very high indeed.Technology stocks will lead the way.
So, the long-term outlook is good. Along the way, tightening monetary policy, problems in emerging markets, and the mid-cycle slowdown may lead to corrections. So in 2015, we may see markets hit a temporary peak, but we'd expect a low to be made at some point in 2016.
Later on, around 2018/2019, we'd expect a mid-cycle economic recession to result in a stock-market correction too. In 2025/2026, the stockmarket will hit its final peak for this cycle ahead of the peak in the economy.
Commodities
As we've already seen in recent years, higher prices for commodities lead to increased production, which tends to push prices lower.
However, expect the general long-term trend of commodity prices to be higher into the mid-to-late 2020s, with prices doing especially well during the 2017-2021 period (when growth is likely to be particularly strong).
Bonds
The outlook for bonds is weak. As the economy returns to normal, central banks will no longer be suppressing the yield curve to the same extent. As a result, we can expect yields to rise and bond prices to fall (yields and prices move inversely to one another).
We're also coming to the end of a long-term bull market in bonds, so we'd expect the long-term trend for prices to be down.
As a market, bonds are worth monitoring the shape of the yield curve is a good indicator of trouble ahead for an economy. We'd keep an eye out for long-term bond yields falling below short-term ones (an inverted yield curve) prior to the mid-cycle slowdown in 2018/2019.
We'd also expect the yield curve to invert again in around 2024/2025, before the next peak. At that point we'd expect developed-world bond prices to rise again as a flight to quality' occurs.
The economy
Economies in the West, especially the US, Germany and UK, are well on the road to recovery. Growth tends to be slow at this point in the cycle. But as bank lending recovers and monetary policy normalises, economies should return to normal growth and employment levels.
We can expect to see a mid-cycle slowdown or even a recession around 2018/2019, but this will just interrupt the expansion rather than halt it. That won't happen until 2026/2027, when we face the cyclical peak and a major slowdown or financial crisis.
How land speculation drives boom and bust
In 2005, economist Fred Harrison wrote the prescient book,Boom Bust: House Prices, Banking and the Depression of 2010, arguing that Britain was entering the winner's curse' phase of the property cycle, and that prices would peak in 2008 an impressive call, particularly given the generally bullish view at the time.
Harrison based his argument on the simple observation that land is in fixed supply. So when the economy grows, the price of land rises more rapidly than wages or other prices. This encourages even more speculation by those keen to profit from locational value', or economic rent' the rise in the value of land that goes alongside a growing economy.
The unproductive pursuit of higher land prices takes up more and more of the economy's resources. Eventually, the high cost of land is squeezing corporate profits so hard, and reducing the money available for wages, that property prices are unaffordable for the majority. Then you get the bust.
Harrison and others who back his view argue that to end the cycle we need tax reform. Instead of taxing wages and savings, we should be taxing this unearned economic rent. This would reduce land speculation, encourage th development of idle land rather than allowing owners to hoard it and still benefit from higher prices and leaven the boom/bust cycle.
Of course, this would also trample on the toes of many vested interests, so it's hard to see full-blown reform ever happening so we can expect this cycle to be very similar to any other.
But for anyone who thinks the land value tax sounds like socialism run wild, it's worth noting that Winston Churchill himself made a speech advocating a land value tax back in 1909, arguing that "every form of enterprise is only undertaken after the land monopolist has skimmed the cream for himself, and everywhere today the man or the
public body that wishes to put land to its highest use is forced o pay a preliminary fine in land values to the man who is putting it to an inferior one, and in some cases to no use at all".
Akhil Patel is director of Ascendant Strategy and Phil Anderson is director of Economic Indicator Services Ltd.
Get the latest financial news, insights and expert analysis from our award-winning MoneyWeek team, to help you understand what really matters when it comes to your finances.
Akhil Patel is director of Property Sharemarket Economics (propertysharemarketeconomics.com).
-
 Average UK house price reaches £300,000 for first time, Halifax says
While the average house price has topped £300k, regional disparities still remain, Halifax finds.
-
 Barings Emerging Europe trust bounces back from Russia woes
Barings Emerging Europe trust has added the Middle East and Africa to its mandate, delivering a strong recovery, says Max King