The charts that matter: the Powell put is in place
The Federal Reserve has done not so much a U-turn as a handbrake turn on monetary policy this week. John Stepek looks at how that’s affected the global economy’s most important charts.

Get the latest financial news, insights and expert analysis from our award-winning MoneyWeek team, to help you understand what really matters when it comes to your finances.
You are now subscribed
Your newsletter sign-up was successful
Want to add more newsletters?

Twice daily
MoneyWeek
Get the latest financial news, insights and expert analysis from our award-winning MoneyWeek team, to help you understand what really matters when it comes to your finances.

Four times a week
Look After My Bills
Sign up to our free money-saving newsletter, filled with the latest news and expert advice to help you find the best tips and deals for managing your bills. Start saving today!
We have a new podcast for you this week, in which Merryn talks to a special guest, Bruce Stout, the manager of the Murray International investment trust. Bruce is an atypical fund manager in that he leans towards the bearish perspective and tends to worry about the same sort of things that we worry about rampant over-indebtedness and central banks messing around being two key points in this particular conversation. Don't miss it.
And if you have any questions that you'd like Merryn and I to address, please do send them in to editor@moneyweek.com. Put "Question for the podcast" in the subject line and we'll see what we can do.
You should also check out Merryn's blog: she's been prolific this week, writing about the fuss over GPs' pensions; the high and rising danger posed by cybercrime and the difficulty of insuring against it; and why even those who are about to hit the lifetime allowance might want to in certain common circumstances consider taking the tax hit and continuing to pay into their pensions anyway.
MoneyWeek
Subscribe to MoneyWeek today and get your first six magazine issues absolutely FREE

Sign up to Money Morning
Don't miss the latest investment and personal finances news, market analysis, plus money-saving tips with our free twice-daily newsletter
Don't miss the latest investment and personal finances news, market analysis, plus money-saving tips with our free twice-daily newsletter
And if you missed any of this week's Money Mornings, here are the links you need. It's been all about melt-ups, Brexit and gold this week.
Monday: The Fed and Brexit: what to watch in the week ahead
Tuesday: China's slowdown is really starting to rattle markets
Wednesday: Back on the Brexit merry-go-round, and what it means for your money
Thursday: The Fed finally gets it all that matters is the S&P 500
Friday: The gold bulls are back so let's just be careful out there
And another reminder for more on Brexit, melt-ups, and lots of other things, come to our event on the evening of 12 February. I'll be talking to MoneyWeek regular Tim Price and Netwealth's Iain Barnes about the latest goings on in the market. Get your ticket here if you haven't already.
And now, over to the charts.
The yield curve (here's a reminder of what it is) improved a little this week, partly as a result of the Federal Reserve conducting not so much a U-turn as a handbrake turn on monetary policy this week. Not only is the Fed suggesting that there might not be any more rate hikes this year, it's also indicated that it's open to adjusting the pace of QT (quantitative tightening, or money burning) if that's what the market really wants.
The chart below shows the difference (the "spread") between what it costs the US government to borrow money over ten years rather than two. Once this number turns negative, the yield curve has inverted which almost always signals a recession (although perhaps not for up to two years).
What's interesting to me is that the Fed shift hasn't yet had more of an effect. You'd expect two-year yields to fall as investors stop pricing in any more hikes over the short term. But you also might expect the ten-year to rise as the market expects longer-term growth and inflation eventually to force the Fed's hand. That hasn't happened in this case both the two and the ten have fallen, keeping the gap between them pretty tight.
In short, I think that shows that investors are relieved, but they still absolutely do not buy the idea that we're going to get inflation taking off any time soon. They still reckon we're facing deflation and recession any minute now.
(The gap between the yield on the ten-year US Treasury and that on the two-year: going back three months)
Gold (measured in dollar terms) has had a great week, which is what you'd expect. Gold's biggest enemy is rising "real" interest rates (as opposed to rising nominal rates). If interest rates go up more rapidly than inflation, gold is in trouble. If the opposite is true, gold is happy. We've now got one part of the equation rates rises are stopping. What we need to see for a real gold bull market is inflation continuing to creep higher.
Dominic wrote about gold this week it's worth reading his piece, particularly if you have latent gold-bug tendencies it could prevent you from making a potentially expensive mistake.
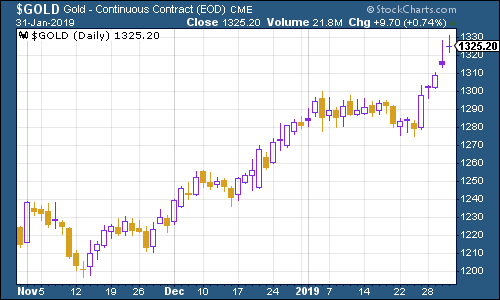
(Gold: three months)
The US dollar index a measure of the strength of the dollar against a basket of the currencies of its major trading partners weakened, meanwhile, which is good news for risk assets (put simply, a stronger dollar means tighter global monetary policy, whereas a weak one means conditions are looser). If dollar weakness continues, the odds of a melt-up are much higher.
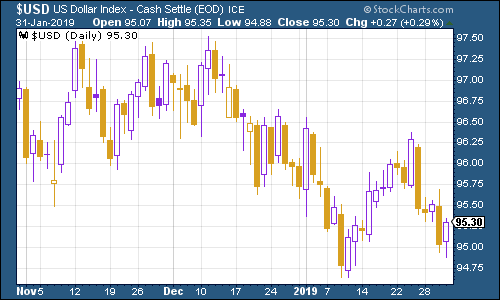
(DXY: three months)
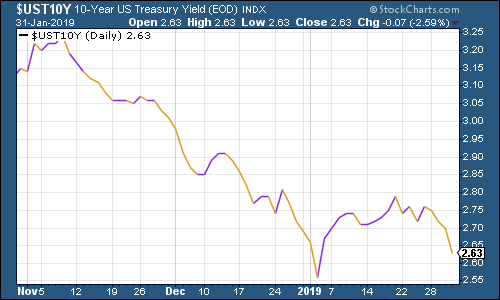
As we noted earlier, the ten-year US Treasury bond yield slipped substantially this week, even as the Fed changed its mind. Same goes for other developed world government bonds the Japanese government bond (JGB) yield is still negative (which I'm not sure Japan's central bank will be shedding any tears over)...
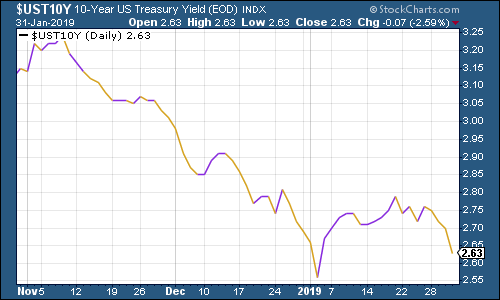
(Ten-year US Treasury yield: three months)
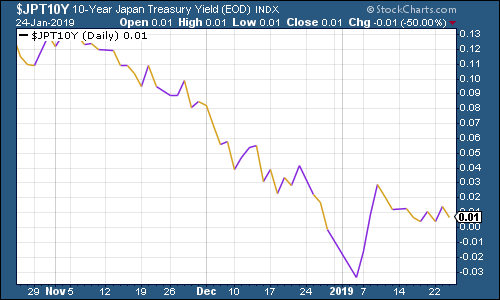
(Ten-year Japanese government bond yield: three months)
while the ten-year German bund yield (the borrowing cost of Germany's government, Europe's "risk-free" rate) slid sharply to its 2019 low. That's also because Germany looks worryingly like it's heading for, or possibly already in, recession (Italy has already fallen into recession, in other eurozone news).
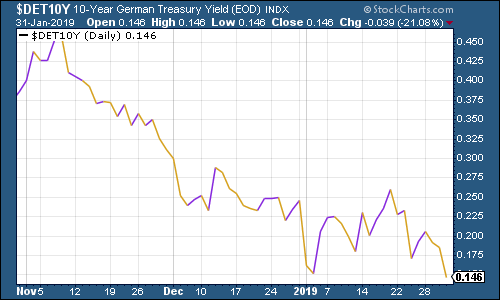
(Ten-year bund yield: three months)
Copper might be the metal with a "phD in economics" but the idea of eurozone recession didn't faze it. Instead, it was much more responsive to the Fed's rate cuts and the hope that China will loosen the reins too.
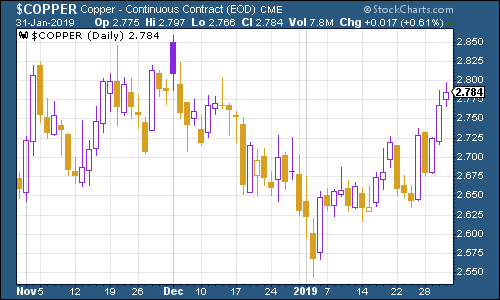
(Copper: three months)
As for the Aussie dollar our favourite indicator of the state of the Chinese economy it had a good week, despite Australia's homegrown problems (all of us in the UK will be very familiar with the issue; it's all about a manic housing boom turning to a full-on bust). The gains for the Aussie are probably not so related to China this week it's a lot more to do with the Fed's change of mind hitting the US dollar.
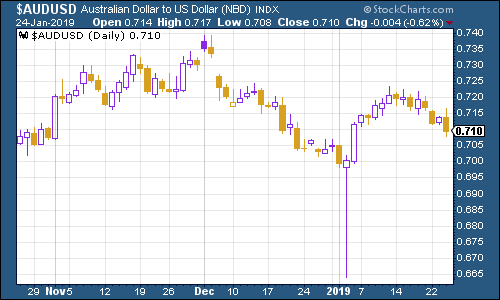
(Aussie dollar vs US dollar exchange rate: three months)
Bitcoin continued to trade in a tight range. News of the Fed's change of heart had a very minor effect on the price, but it reversed quickly. Again, it's hard to figure out what moves the cryptocurrency one way or another.
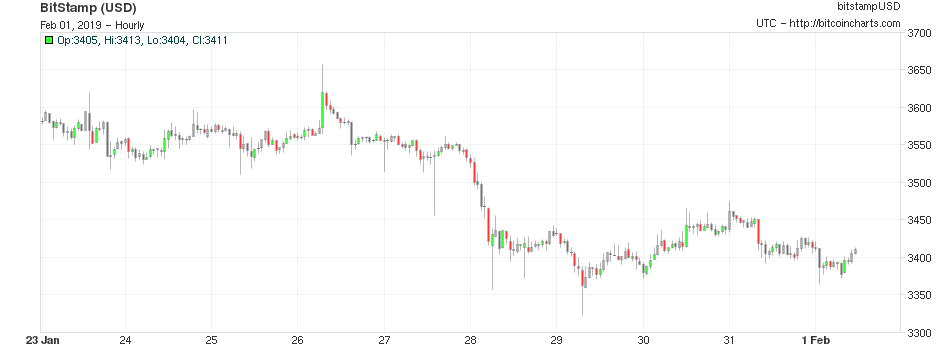
(Bitcoin: ten days)
The four-week moving average of weekly US jobless claims rose this week to 220,250, as weekly claims surged higher to 253,000, an 18-month high. We do have to take this data with a pinch of salt because the government shutdown may have pushed the figures higher, and I would be cautious about assuming that we've seen the trough for this cycle, although it's certainly possible.
David Rosenberg of Gluskin Sheff (who is now very bearish) has noted in the past that US stocks typically don't peak until after the moving average of jobless claims has hit a low for the cycle. On average, the stockmarket peaks about 14 weeks after the trough, with a recession following about a year later. (This is taken from a small sample size with a lot of variation, so it really is only a rough guideline).
The most recent trough came on 15 September, at 206,000. If that was the bottom, it implies that the market has already peaked, and that a recession may follow this year or in 2020.
Yet jobless figure could still go lower from here, so I would hesitate to draw any conclusions from this alone as yet. Particularly as the latest nonfarm payrolls report in the US was staggeringly strong. The US economy apparently added another 304,000 jobs in January. The market had expected 165,000 jobs.
It's worth noting that there was a chunky revision lower from last month's surprisingly strong figure it went from 312,000 down to 222,000 (which shows you how flakey these numbers are). Wage growth was also lower than expected, at 3.2%, although the annual rate for December was revised higher to 3.3%.
In short, even with the revisions, this was all still very solid, so it's hard to be overly negative about this data right now. (And until wage inflation rockets, markets won't be overly nervous about the Fed's reaction to this sort of figure either which puts us back in Goldilocks territory).
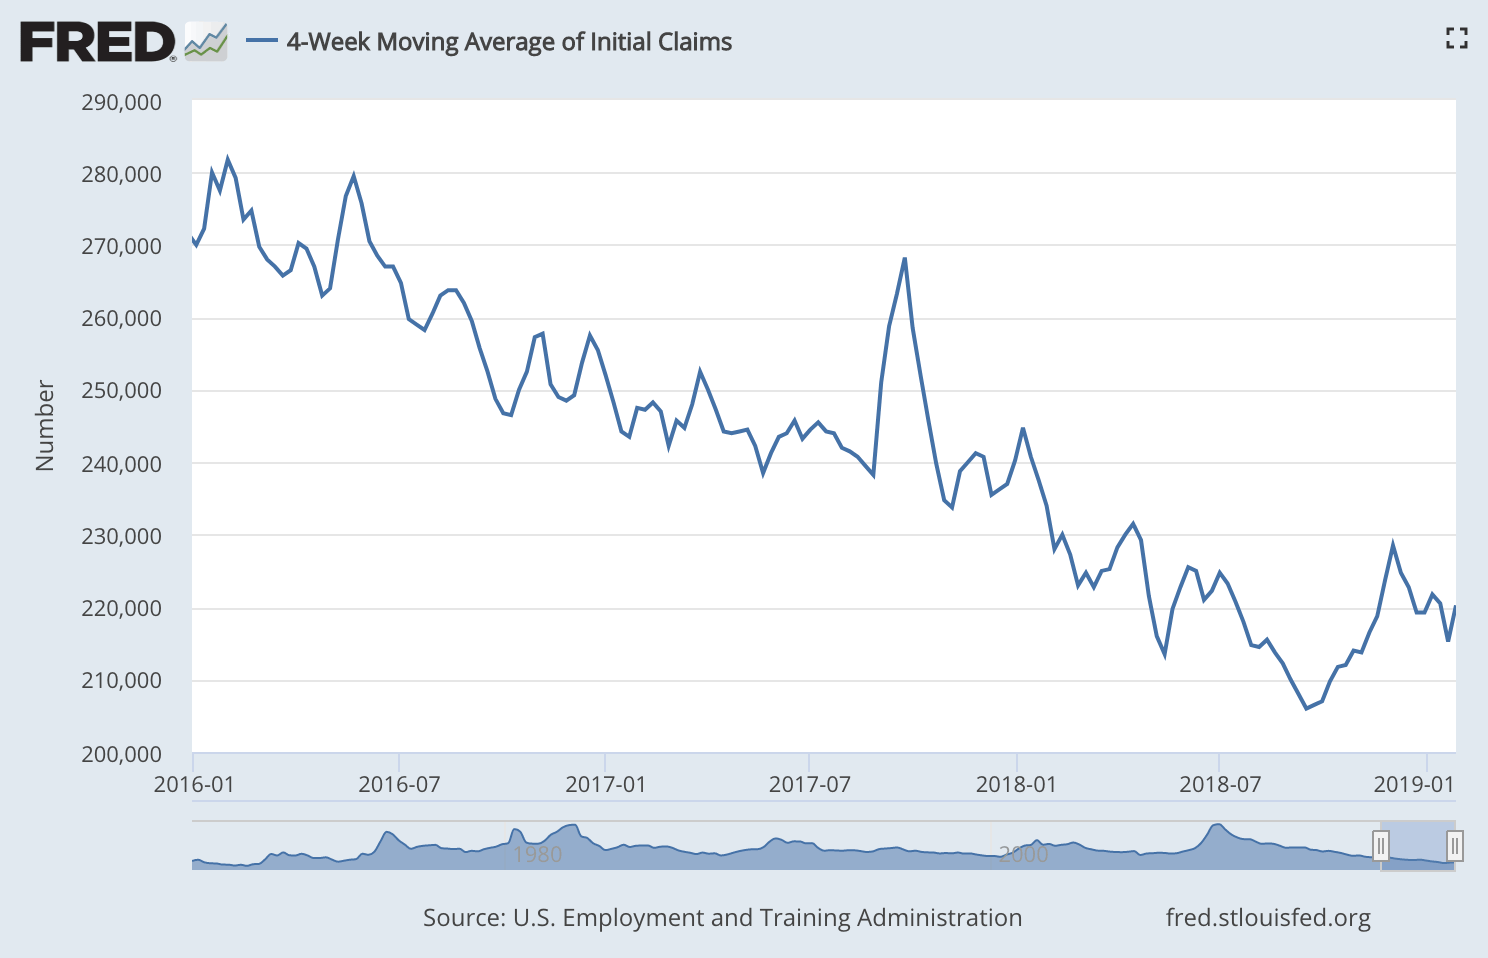
(US jobless claims, four-week moving average: since January 2016)
Perhaps surprisingly, the oil price (as measured by Brent crude, the international/European benchmark) didn't do much. With other risk assets bouncing you'd have expected it to do well this week. That suggests, I think, that scepticism on global growth is still strong.
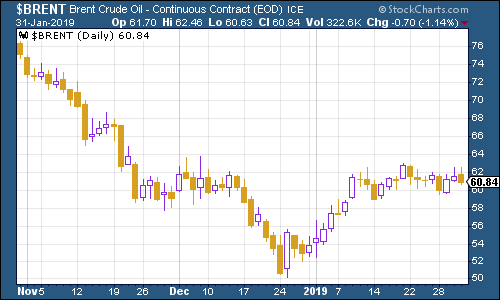
(Brent crude oil: three months)
Internet giant Amazon was looking interesting. This time last week, it looked as though Amazon was falling back again, having made a lower high suggesting that the downtrend in the stock would continue. But the Fed's U-turn had a very clear effect indeed. I reckon that if Amazon can push convincingly back above the $1,800 mark or so, then it's another strong sign that we're back in "risk-on" mode.
That said, however, the company saw its share price take a hit in after-hours trading on Thursday (not shown on the chart below) when it said it would be increasing its investments this year. Amazon investors should be used to this, but they still don't like the idea that they won't just be able to suck out the juicy profits from the company rather than ploughing them back into yet more world-domination schemes.
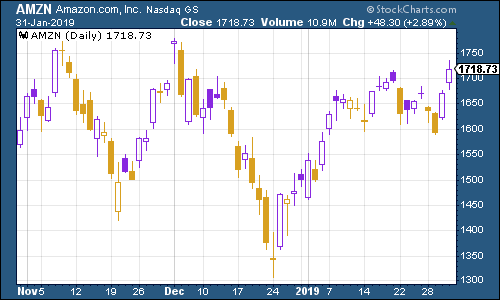
(Amazon: three months)
Electric car group Tesla rallied somewhat following its recent warning on the growth challenges it faces and the job cuts it pushed through as a result.
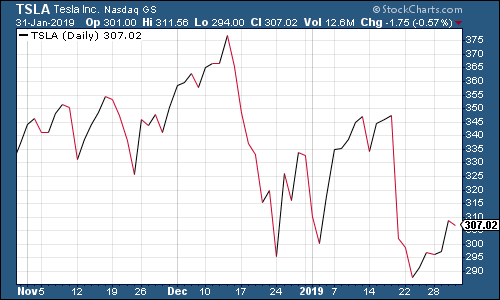
(Tesla: three months)
Have a great weekend. And don't forget to get your ticket for our event on 12 February!
Get the latest financial news, insights and expert analysis from our award-winning MoneyWeek team, to help you understand what really matters when it comes to your finances.

-
 Can mining stocks deliver golden gains?
With gold and silver prices having outperformed the stock markets last year, mining stocks can be an effective, if volatile, means of gaining exposure
-
 8 ways the ‘sandwich generation’ can protect wealth
People squeezed between caring for ageing parents and adult children or younger grandchildren – known as the ‘sandwich generation’ – are at risk of neglecting their own financial planning. Here’s how to protect yourself and your loved ones’ wealth.