Are we heading for a winter of stockmarket discontent?
The stock market usually goes through a number of different cycles each year - right now, it's entering what is historically the strongest six months for stocks. But things have been a little different this year.
Get the latest financial news, insights and expert analysis from our award-winning MoneyWeek team, to help you understand what really matters when it comes to your finances.
You are now subscribed
Your newsletter sign-up was successful
Want to add more newsletters?

Twice daily
MoneyWeek
Get the latest financial news, insights and expert analysis from our award-winning MoneyWeek team, to help you understand what really matters when it comes to your finances.

Four times a week
Look After My Bills
Sign up to our free money-saving newsletter, filled with the latest news and expert advice to help you find the best tips and deals for managing your bills. Start saving today!
The stock market usually goes through a number of different cycles each year - and right now, it's headed into what is historically the strongest six months of the year for stocks.
As we approach the end of 2006, the market has actually followed a few key trends:
At this point, we're at the end of the much-publicized 'Sell in May and go away' period - the six-month spell from May to October that is traditionally the worst time to own stocks.
MoneyWeek
Subscribe to MoneyWeek today and get your first six magazine issues absolutely FREE

Sign up to Money Morning
Don't miss the latest investment and personal finances news, market analysis, plus money-saving tips with our free twice-daily newsletter
Don't miss the latest investment and personal finances news, market analysis, plus money-saving tips with our free twice-daily newsletter
And true to form, just about all the indexes made significant highs around May 7, then proceeded to sell off heavily for the next two months, as if they were following a script.
The next phase in the annual cycle is the annual summertime rally, which began right on schedule about mid July, and usually lasts until late August or early September.
But that's when things changed. So let's see how events unfolded differently - and what the market has in store for us next...
No September slump - so will there be a year-end rally?
If you're like me and like to look at the market from a technical analysis standpoint, you'll know that for the last couple of months, it's deviated from its normal routine quite dramatically.
And it's provided technical analysts with an intriguing set of circumstances.
Once the summertime rally ends around late August, it ushers in another downward-cycle phase that usually bottoms out between late September and early October (hence the reason why September is historically one of the worst months of the year to own stocks), right before the traditional 'year end' rally begins.
This downward trend is especially true during mid-term election years - and the supporting data for this stretches all the way back to 1950. But so far, the market's behavior during the current mid-term election year cycle has been the exception to the rule.
Enjoying this article? For two recommended articles like this every day, plus the latest investment news and opinion from MoneyWeek, sign up to our FREE daily email, Money Morning. CLICK HERE
The rally that began in July has proved to be very strong, with the Dow, S&P 500, and NASDAQ Composite all making new highs for the year. Investors have ploughed into the market with such gusto that we haven't even seen a decent pullback over the September-October timeframe. This has caught many students of the market off-guard.
Where does the market go from here?
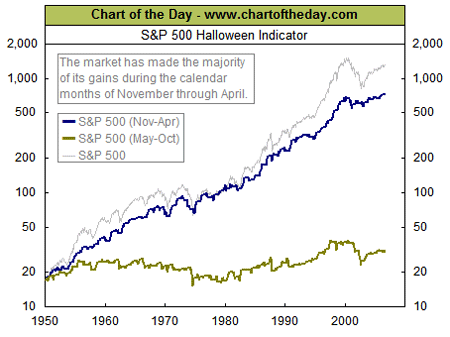
As I mentioned, stocks are now entering what is historically the best six-month period of the year to own stocks. To support this, take a look at the chart below, and you'll see how it perfectly illustrates that investing in the S&P 500 on the last trading day in October until the end of April has accounted for the vast majority of the index's gains since 1950. While there are some noteworthy exceptions (1973-74 & 2000-01), the overall outperformance is compelling.

Chart Courtesy of Chart Of The Day
Will the market spring a cyclical surprise?
But here's the problem - at least from a cyclical standpoint: Since the S&P 500 bottomed out this summer, it's climbed around 14% - a great performance by any measure.
So if the markets are now about to enter their best six months of the year, is this just the beginning of a 'super' bull market? Or since the market has strayed from its normal cycle pattern, are we in store for another cyclical surprise?
Well, while it's still a little too early to tell just yet, I can tell you that having studied market cycles over the past several years, I'm seeing what I call a 'cycle inversion.'
What is Cycle Inversion?
When this occurs, you basically get a cycle low that actually turns out to be a cycle high, and a cycle high that turns out to be a cycle low.
Cycle inversions generally occur once investors become aware of them and begin to position themselves accordingly. It's possible that this year's traditional mid-term election selloff was short-circuited because the cycle theory has become more popular. And on Wall Street, once something becomes popular, it no longer works as well.
I'll give you an example: Throughout September, despite the strong rally, the put/call ratio stayed abnormally high. That means investors were expecting a selloff, thanks to the talking heads on television - and consequently bought a lot of puts.
The put/call ratio is a contrary indicator, based on the premise that the public is usually wrong. So when the September selloff didn't materialize, investors had to cover their short positions - a situation that pushed stocks even higher through October.
So pay close attention in September-October 2007. Investors will remember how things have unfolded this year, and if you see a lot of call buying, we can then again expect the normal September-October selloff.
Should investors be bullish or bearish?
One thing I do know is that after seeing an uninterrupted rally of 14%, the market is overbought on many technical levels, and is at least due for a consolidation phase, if not a pullback or correction.
The proprietary cycle program I use shows the cycles topping out around now, give or take a week or two. And another cycle analyst whose work I respect is calling for a top between November 6 and November 13.
That leaves us with two questions: How do we deal with the conflicting cycles? And will the normally best six months of the year turn out to be a bust? Let's look at the bullish and bearish scenarios...
Bullish: The Dow, S&P 500, Nasdaq Composite, and all three of the major European indexes are sitting at new highs for the year. It appears that at least the European indexes have a bit further to go, and if the Nasdaq 100 can make a weekly close above its 2006 high (1,761) the rally should continue - especially if the smaller-cap indexes follow suit.
Bearish: The Dow and S&P 500 have already reached their minimum upside objectives, and after a great run, are now set up for sell signals. The Dow Transports are still more than 6% away from making new highs for the year and if they don't, it sets up a potential Dow Theory sell signal. If the Nasdaq 100 and smaller-cap indexes fail to make new highs, it sets up additional bearish divergence.
With so many uncertainties, the simplest form of technical analysis is price action. So let's do a quick breakdown of the S&P 500...

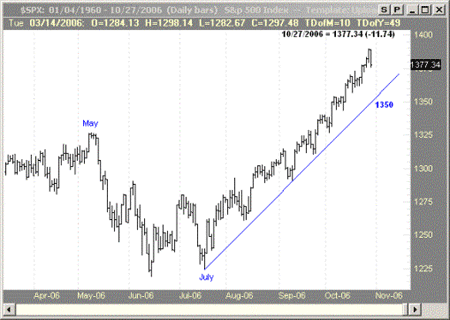
Chart Courtesy of Trade Navigator Software: https://www.genesisft.com
As shown, the uptrend line from the July lows is currently at 1,350. But this will move up, and the uptrend will stay intact until we see two closes below the trendline.
If that occurs before the Dow Transports, Nasdaq 100, and the smaller-cap indexes make new highs for the year, it should lead to additional selling - possibly a severe reversal. But if the price action stays above the trendline, the rally can continue.
By Jim Stanton of Mt. Vernon Research for the Smart Options Report, www.smartoptionsreport.com
Get the latest financial news, insights and expert analysis from our award-winning MoneyWeek team, to help you understand what really matters when it comes to your finances.
MoneyWeek is written by a team of experienced and award-winning journalists, plus expert columnists. As well as daily digital news and features, MoneyWeek also publishes a weekly magazine, covering investing and personal finance. From share tips, pensions, gold to practical investment tips - we provide a round-up to help you make money and keep it.
-
 Average UK house price reaches £300,000 for first time, Halifax says
While the average house price has topped £300k, regional disparities still remain, Halifax finds.
-
 Barings Emerging Europe trust bounces back from Russia woes
Barings Emerging Europe trust has added the Middle East and Africa to its mandate, delivering a strong recovery, says Max King

