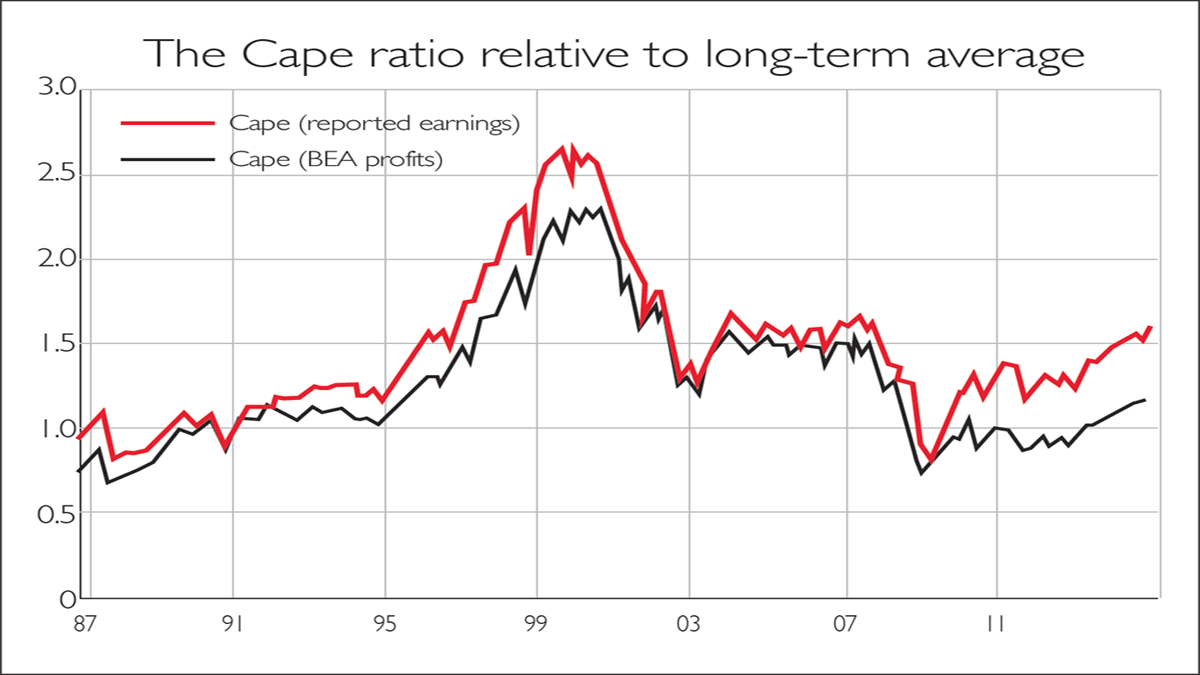
How dear are US stocks?
The Cape ratio is a popular metric for valuing stockmarkets. Cris Sholto Heaton explains how it works, and what it tells us about the American market.

Get the latest financial news, insights and expert analysis from our award-winning MoneyWeek team, to help you understand what really matters when it comes to your finances.
You are now subscribed
Your newsletter sign-up was successful
Want to add more newsletters?

Twice daily
MoneyWeek
Get the latest financial news, insights and expert analysis from our award-winning MoneyWeek team, to help you understand what really matters when it comes to your finances.

Four times a week
Look After My Bills
Sign up to our free money-saving newsletter, filled with the latest news and expert advice to help you find the best tips and deals for managing your bills. Start saving today!

The cyclically adjusted price/earnings (Cape) ratio is a popular metric for valuing stockmarkets, especially among investors who believe that the US market is grossly overvalued by historical standards. Cape, which was devised by Robert Shiller of Yale University and John Campbell of Princeton University, measures the value of the market relative to average earnings over the past ten years, adjusted for inflation.
At present, the Cape for the US is around 26, compared with a long-term average of around 16. On face value, this suggests that unless earnings grow much faster than they have done over the long term, investors are likely to be disappointed.
But could the Cape ratio be overstating how expensive the US market is? Some analysts and investors argue that record-low interest rates and long-term bond yields justify higher stock prices. Financial assets aren't valued in isolation, but relative to each other: if you can only get 1.5% per year from bonds (after inflation), compared with almost 3.5% per year over the last 50 years, you might expect stocks to be priced to give you 4% per year, say, rather than the 6% you might previously have expected.
MoneyWeek
Subscribe to MoneyWeek today and get your first six magazine issues absolutely FREE

Sign up to Money Morning
Don't miss the latest investment and personal finances news, market analysis, plus money-saving tips with our free twice-daily newsletter
Don't miss the latest investment and personal finances news, market analysis, plus money-saving tips with our free twice-daily newsletter
Make a few assumptions about what investors can reasonably expect in today's market environment and the US Cape ratio no longer looks stretched, says John Higgins of Capital Economics: it's possible that it should be around 23-24, suggesting the market is modestly overvalued at best.
Of course, this assumes that interest rates remain low by long-term standards. That's quite possible central banks are in no rush to hike but not guaranteed.Significantly higher rates would make stocks look expensive. But would they still be as expensive as one would conclude from comparing Cape to its history? Possibly not, says Jeremy Siegel of Wharton Business School in a recent paper in the Financial Analysts Journal.
The Cape ratio today is not exactly the same as it would have been decades ago, because earnings have not been calculated consistently over time. "Changes in accounting practices since 1990 have depressed reported earnings during economic downturns to a much greater degree than in the earlier years."
If instead you calculate the Cape using national statistics on corporate profits compiled by the Bureau of Economic Analysis (BEA), instead of those reported by companies, it looks more reasonable relative to its long-term average (see chart above).
Allow for the fact that firms increasingly return cash through share buybacks rather than dividends, which pushes up growth rate of earnings per share (because there are fewer shares in issue), and the overvaluation shrinks further. All told, it's still very difficult to make the case that US stocks are cheap today, but they may not be as expensive as the Cape ratio suggests.
Get the latest financial news, insights and expert analysis from our award-winning MoneyWeek team, to help you understand what really matters when it comes to your finances.

Cris Sholt Heaton is the contributing editor for MoneyWeek.
He is an investment analyst and writer who has been contributing to MoneyWeek since 2006 and was managing editor of the magazine between 2016 and 2018. He is experienced in covering international investing, believing many investors still focus too much on their home markets and that it pays to take advantage of all the opportunities the world offers.
He often writes about Asian equities, international income and global asset allocation.
-
 ISA fund and trust picks for every type of investor – which could work for you?
Whether you’re an ISA investor seeking reliable returns, looking to add a bit more risk to your portfolio or are new to investing, MoneyWeek asked the experts for funds and investment trusts you could consider in 2026
-
 The most popular fund sectors of 2025 as investor outflows continue
It was another difficult year for fund inflows but there are signs that investors are returning to the financial markets