House prices could fall another 40% from here
Despite stirrings in the property market, houses are still not affordable. Prices will fall for quite a while yet, says James Ferguson - but it will be worth the wait.
Get the latest financial news, insights and expert analysis from our award-winning MoneyWeek team, to help you understand what really matters when it comes to your finances.
You are now subscribed
Your newsletter sign-up was successful
Want to add more newsletters?

Twice daily
MoneyWeek
Get the latest financial news, insights and expert analysis from our award-winning MoneyWeek team, to help you understand what really matters when it comes to your finances.

Four times a week
Look After My Bills
Sign up to our free money-saving newsletter, filled with the latest news and expert advice to help you find the best tips and deals for managing your bills. Start saving today!
There have been stirrings of excitement in the property market recently. Data on activity, such as home loan approvals, has been picking up ever so slightly. And I've seen it at first hand too.
I was a member of the panel at an investors' seminar hosted by PFP Group in Harrogate last week. Two investors came up to me at separate times and said they were trying to buy properties but the market had got very tight and the estate agents they were talking to had never been busier. Did I think we'd already seen the bottom?
I had to disappoint them. I don't think we've seen the bottom in fact, I don't think we're anywhere close. Here's why...
MoneyWeek
Subscribe to MoneyWeek today and get your first six magazine issues absolutely FREE

Sign up to Money Morning
Don't miss the latest investment and personal finances news, market analysis, plus money-saving tips with our free twice-daily newsletter
Don't miss the latest investment and personal finances news, market analysis, plus money-saving tips with our free twice-daily newsletter
Affordability is the problem in the UK housing market...
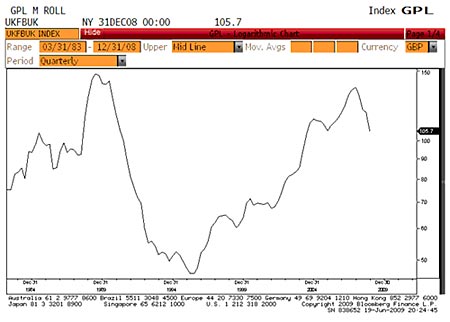
The problem in the UK housing market is affordability or the lack of it. We are nowhere near the levels where the market can start to resuscitate. The Nationwide Building Society's first-time buyer affordability index (black line on the chart below), which measures initial home loan payments as a percentage of take-home pay (so the higher the index, the worse affordability is), is still five years away from a market trough if the last housing downturn is anything to go by.

The low on the affordability index was 46, in March 1996, which was around about bang on when house prices finally began to trend up again after the 1989-95 sell-off. House prices are of course part of the mix of the affordability equation and so it's no surprise to see that the index fell faster in the early days of 1989-93 than it did when house prices were much closer to levelling out in 1993-96 (i.e. still falling but at a much slower rate).
Enjoying this article? Sign up for our free daily email, Money Morning, to receive intelligent investment advice every weekday. Sign up to Money Morning.
Bringing that analogy forward to today's market, the index (which is quarterly and lagged, so the most recent datum is December 2008) is currently 105.7, or less than a third of the way down to cycle-low affordability. As at end-December, the Nationwide house price index was 14.75% below its peak. Can we say that a drop of that size is likewise less than a third of the required correction? Probably not, but almost no matter how you look at the UK housing market be that through the UK house price to history ratio; the house price to GDP ratio; the ratio of house prices to other assets, or house prices to earnings you get the same sort of target fall: 40-50% in real terms. Given that 1989-1996 saw a real-terms drop of nigh-on 40%, that's not so surprising.
...but that's only half the story
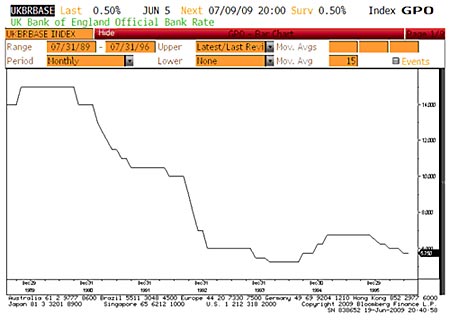
Aha! Say some. Surely the late 1980s were characterised by super-high interest rates, so it was no wonder prices fell. Well actually, the super-high rates were at the peak of the market. Rates fell every year from 1990 to 1994 and again 1995-1996. Yet real house prices fell in each and every year. Because affordability (in terms of monthly outgoings) is only half the story. If I'm a buy-to-let landlord and my rental income now exceeds my home loan payments (for the first time in quite a while) that does not mean I make money, even after all costs.

The change in the value of the property is critical. Even small percentage changes in capital value far outweigh any considerations about rent, a fact that the property cheerleaders made the most of during the upswing. Even though we could see it would all end in tears because rents weren't covering outgoings, landlords were still enjoying total returns that were comfortably positive.
In the end, it wasn't just net rents that couldn't cover a 100% home loan some landlords found that gross rents (before all costs, voids, etc) wouldn't even cover loans that were well short of 100%. Such warning signs went unnoticed by far too many people. Yet now, many still want to rush back into the burning building just because a temporary change in wind direction has blown the smoke away to one side.
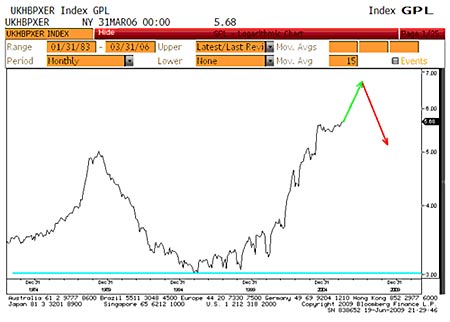
HBOS, presumably a bit concerned by just how unaffordable its data was making UK houses look, stopped publishing its house price to earnings ratio in early 2006. This is just one of the problems with data on housing: it all comes from less-than-neutral sources such as estate agents and lenders. Still we can do a rough update by using HBOS house prices and weekly earnings from the government's ASHE (Annual Survey of Hours and Earnings).
According to HBOS, house prices peaked out in August 2007 at £201,000. Average weekly gross earnings in the UK in 2007 were £376 (£19,552 a year). Multiplying that by about 1.5 brings single person earned income up to (earned and non-earned, usually two-person) household income of around £29,900. The house price to income ratio would therefore have been around 6.72 times at its peak, using the HBOS measure.
So have house prices hit the bottom?
On the same basis, today, the ratio, based on an assumed average household income of £31,200 and an average HBOS house price of £160,869 is still a very high 5.16 times. To give you an idea of just how high that is, it's still above the 1989 peak ratio of 5.02 times.

Now if that looks like a fully mature sell-off to you, then I say go for it and pile back into the property market. Personally, I think I'll wait until either one of the affordability or the long-term house price to earnings ratios returns to 'buy' signal territory.
History says it may take a while; perhaps three to five years. But history also suggests it'll be worth the wait. The downside could easily be 40% in real terms, even from here. Just look at what's happened in the US already (-32% and falling, judged by the Case-Shiller index) if you don't believe me.
You can read more of James's views on the economy and what you should be investing in to protect your wealth during the slump in his weekly email newsletter, Model Investor.
Our recommended article for today
Tap in to profits from natural gas
With natural gas and natural gas companies 'super cheap' at the moment, there's never been a better time to buy. Chris Mayer explains why.
Get the latest financial news, insights and expert analysis from our award-winning MoneyWeek team, to help you understand what really matters when it comes to your finances.
James Ferguson qualified with an MA (Hons) in economics from Edinburgh University in 1985. For the last 21 years he has had a high-powered career in institutional stock broking, specialising in equities, working for Nomura, Robert Fleming, SBC Warburg, Dresdner Kleinwort Wasserstein and Mitsubishi Securities.
-
 Average UK house price reaches £300,000 for first time, Halifax says
While the average house price has topped £300k, regional disparities still remain, Halifax finds.
-
 Barings Emerging Europe trust bounces back from Russia woes
Barings Emerging Europe trust has added the Middle East and Africa to its mandate, delivering a strong recovery, says Max King