Get the latest financial news, insights and expert analysis from our award-winning MoneyWeek team, to help you understand what really matters when it comes to your finances.
You are now subscribed
Your newsletter sign-up was successful
Want to add more newsletters?

Twice daily
MoneyWeek
Get the latest financial news, insights and expert analysis from our award-winning MoneyWeek team, to help you understand what really matters when it comes to your finances.

Four times a week
Look After My Bills
Sign up to our free money-saving newsletter, filled with the latest news and expert advice to help you find the best tips and deals for managing your bills. Start saving today!
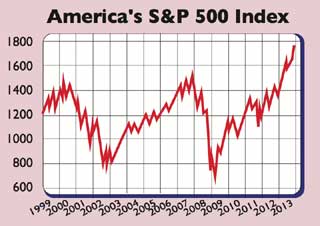
American equity markets "have left milestones for dust", says Michael Mackenzie in the FT. The S&P 500, which sets the tone for world markets, has surged through the 1,500, 1,600 and 1,700 marks this year. It has gained more than 25% and is on track for its best year since the dotcom glory days of 1997. The index has also risen for eight successive weeks its longest winning run in nine years. The Dow Jones has reached a new record above 16,000. The tech-heavy Nasdaq index is at a 13-year peak.
But is this yet another bubble waiting to burst? It's becoming increasingly difficult to ignore signs of irrational exuberance, as Michael Snyder points out on Etfdailynews.com. "Despite assurances from the mainstream media and the Federal Reserve that everything is just fine", people are getting worried: Google searches for the term stock bubble' are at their highest level since the pre-meltdown year of 2007.
Consider, says Snyder, that since the bottom of the bear market in 2009 the Nasdaq has more than tripled, while the S&P 500 has gained 167%. "This does not reflect economic reality in any way,shape, or form."
MoneyWeek
Subscribe to MoneyWeek today and get your first six magazine issues absolutely FREE

Sign up to Money Morning
Don't miss the latest investment and personal finances news, market analysis, plus money-saving tips with our free twice-daily newsletter
Don't miss the latest investment and personal finances news, market analysis, plus money-saving tips with our free twice-daily newsletter

S&P 500 profits are currently expanding at an annual pace of just 4%. The achingly slow labour market rebound and political gridlock in Washington are also clouds on the horizon. "Even the most bullish investor would admit that sluggisheconomic growth, a lacklustre labour market, and political discord are hardly the logical bedfellows of a stockmarket at new highs," says ConvergEx's Nicholas Colas.
Signs of mounting froth abound. Margin debt has reached a record. This year money has poured into US equity funds and ETFs at the fastest rate since records began in 1992. New share issues in 2013 are at levels reminiscent of the dotcom days.
The Nasdaq is on a high price/earnings (p/e) ratio of 25. The S&P is on a cyclically adjusted p/e ratio (CAPE) of 25, compared to a long-term average of 16. The CAPE is the most reliable indicator of long-term returns, and it is saying that long-term returns from here on will be poor.
Note, too, that one of the few people to call the dotcom bubble correctly, Robert Shiller, is concerned about froth in US stocks. With the Fed still hurling printed money at the financial system, the gulf between stock prices and fundamentals is set to widen further, suggesting that when liquidity-addicted investors come to their senses, the hangover could be all the more painful.
Get the latest financial news, insights and expert analysis from our award-winning MoneyWeek team, to help you understand what really matters when it comes to your finances.
MoneyWeek is written by a team of experienced and award-winning journalists, plus expert columnists. As well as daily digital news and features, MoneyWeek also publishes a weekly magazine, covering investing and personal finance. From share tips, pensions, gold to practical investment tips - we provide a round-up to help you make money and keep it.
-
 Ayatollah Ali Khamenei: Iran’s underestimated chief cleric
Ayatollah Ali Khamenei is the Iranian regime’s great survivor portraying himself as a humble religious man while presiding over an international business empire
-
 'AI will change our world in more ways than we can imagine'
Interview Rob Arnott of Research Affiliates talks to Andrew Van Sickle about the AI bubble, the impact of tariffs on inflation and the outlook for gold and China

