How low will gold go?
Precious metals have had an exceptional 12 months, with the price of gold and silver rocketing. But now we are seeing a correction. Dominic Frisby looks at the phases of a typical gold bull market, and asks where we're likely to see the gold price go from here.
Get the latest financial news, insights and expert analysis from our award-winning MoneyWeek team, to help you understand what really matters when it comes to your finances.
You are now subscribed
Your newsletter sign-up was successful
Want to add more newsletters?

Twice daily
MoneyWeek
Get the latest financial news, insights and expert analysis from our award-winning MoneyWeek team, to help you understand what really matters when it comes to your finances.

Four times a week
Look After My Bills
Sign up to our free money-saving newsletter, filled with the latest news and expert advice to help you find the best tips and deals for managing your bills. Start saving today!
Gold and silver have both entered a correction phase.
Gold began 2011 at around $1,420 an ounce. By the end of last week, it was more than 3% lower at $1,370. Silver, meanwhile, toasted the New Year at around $31 an ounce. Celebrations were due it had risen some 80% in 2010 but the hangover quickly set in. A week later it was down more than 5% at around $28.60.
Meanwhile, at $34, Silver Wheaton one of the leading silver stocks is now down over 20% from its early December high of $42. That's quite a wallop.
MoneyWeek
Subscribe to MoneyWeek today and get your first six magazine issues absolutely FREE

Sign up to Money Morning
Don't miss the latest investment and personal finances news, market analysis, plus money-saving tips with our free twice-daily newsletter
Don't miss the latest investment and personal finances news, market analysis, plus money-saving tips with our free twice-daily newsletter
But gold and silver have had a stellar 12 months. This correction is overdue. And it's one that I welcome. Nothing goes up in a straight line and all that. Ultimately, it will add to the longevity of this bull market.
How low will gold go?
The fundamental argument for gold has not changed. The world over, we still have inflation, deflation, negative real rates of interest, unpayable debts at most levels of society, unsustainable deficits, out-of-control government spending, misguided monetary policy leading to mal-investment, excessive speculation and bubbles I could go on.
There are many drivers to this bull market in gold, and none have gone away. Nevertheless, corrections are inevitable. We have one now. The question is: 'How low will it go?'
I'd like to try and answer that as I feel I've made a bit of a discovery: the 144-day moving average. It doesn't sound that exciting, but it's amazing how well it has been working over the last two years.
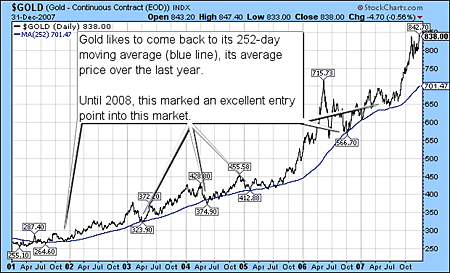
There are 252 trading days in a year. Prior to the crash of 2008, once or twice a year, gold would return to its 252-day moving average (the average price of gold over the previous 252 days). It would flirt with it for a while, before making its next move up.
Here is a chart of gold from 2001 to 2008, which demonstrates this:

Charts courtesy of Stockcharts
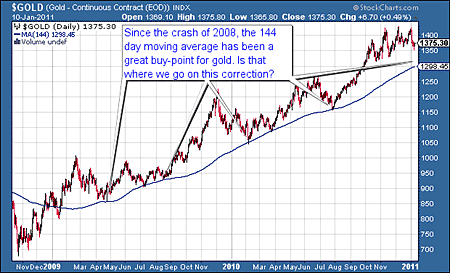
However, since rebounding off the crash of 2008, it has not gone back to this line once. Rather, the 144-day moving average (blue line on the chart below) has been the line to which gold has returned. It seems to go there two or three times a year.

That 144-day moving average currently lies at around $1,300 an ounce and rising. I suspect we will get to it on this correction. If we follow the time scale of previous corrections, then we should reach the low towards the end of January.
If gold bursts down through that line with volume, then we are in for something a bit more serious than a normal, ongoing bull-market correction. But I am fairly confident it will hold, barring some sort of global liquidity panic.
For those of you who want to follow gold against this moving average, here is a chart that will track progress.
If gold does get to this line, one low-risk trade might be to buy gold at the moving average with a stop just below.
I should say that when gold corrects, you usually see one wave of selling. This is followed by a bounce, which is then followed by a second wave of selling, at the bottom of which you see the low.
We have had the first wave of selling and, as I write this, we now seem to be enjoying the bounce. So it's likely that that second wave of selling is just around the corner.
The three phases of bull markets
It is said that a major bull market has three phases. The first phase is the stealth phase, where only the 'smart money' gets onboard. This is followed by a correction. The second phase, typically the longest, is known as the 'wall of worry' phase. This is when more and more institutions start to come onboard, the sector receives more and more media coverage, but there is still a great deal of incredulity and denial. People think they are too late to invest.
Finally, we have the euphoria the mania phase where the proverbial shoe shine boy starts giving you advice.
If you look at stock markets, you saw this stealth phase between 1980 and 1987, before we got the crash. From 1987 to the Asian crisis of 1998 we enjoyed phase two, the 'wall of worry' phase. Then from 1999 to 2000 came the insanity.
This is a fairly arbitrary cycle of course. But I would argue that we are somewhere in phasetwo in this gold bull market. I am still amazed at how few people actually own gold. Phase one, the stealth phase, was between 2001 and 2008 and ended with that bone-shaking meltdown.
Gold consistently found support during phase-one pullbacks at its one-year or 252-day moving average. With the acceleration that you often see in part two, perhaps the 144-day moving average will define this second 'wall of worry' phase, consistently marking support. We shall see.
The 252-day moving average still works for gold stocks
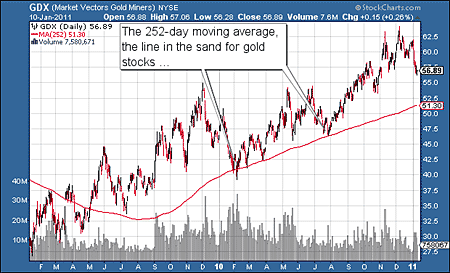
For gold stocks, however, the 252-day moving average has been dependable. It was a fairly reliable guide to rough entry points into the sector from 2001 to 2008, but here we see what a remarkable marker it has been since 2009. This a chart of GDX, the exchange-traded fund (ETF) for the major gold stocks:

It's amazing to see how it 'kissed' the average in early August 2010, before its stellar run since. Just as I am looking for gold to head back to about $1,300 and its 144-day moving average, I am looking for GDX to head back to the $51-52 area, another 10% or so from here.
For those who want to track the chart, here is a live link.
By the way, it's worth noting how gold made three attempts to break through the $1,425 mark and failed. But as gold was making its third attempt, the gold stocks were putting in a much lower high. That is your 'bearish divergence'. Gold's move was not confirmed by the stocks, which were weaker. The stocks did not 'believe' the move. That is often a sign of trouble ahead.
It's also worth noting that since its first November high, gold has lagged the broader US indices, which have gone on to post higher highs. Like gold, however, emerging market indices also lagged.
As I have noted before, we have been in an 'all-one-market' environment, where all asset classes rise as the US dollar falls and vice versa. But if, as we're seeing now, not all markets are rising together anymore, then we have something to think about. Just as gold's high was unconfirmed by the gold stocks, the S&P 500's recent high has been unconfirmed by other global indices. That could portend trouble ahead for the US market.
Nevertheless, I am looking for a turbulent month which should see a move for gold back to its 144-day moving average, where I am guessing it might find support. That hopefully will mark yet another entry-point into this wonderful bull market.
Our recommended article for today
Profit as a weak euro boosts German exporters
A weakened euro is great news for investors in German industrial stocks, says David Stevenson. Here, he tips a solid, cheap German stock to buy now.
Get the latest financial news, insights and expert analysis from our award-winning MoneyWeek team, to help you understand what really matters when it comes to your finances.
MoneyWeek is written by a team of experienced and award-winning journalists, plus expert columnists. As well as daily digital news and features, MoneyWeek also publishes a weekly magazine, covering investing and personal finance. From share tips, pensions, gold to practical investment tips - we provide a round-up to help you make money and keep it.
-
 Average UK house price reaches £300,000 for first time, Halifax says
While the average house price has topped £300k, regional disparities still remain, Halifax finds.
-
 Barings Emerging Europe trust bounces back from Russia woes
Barings Emerging Europe trust has added the Middle East and Africa to its mandate, delivering a strong recovery, says Max King

