Get the latest financial news, insights and expert analysis from our award-winning MoneyWeek team, to help you understand what really matters when it comes to your finances.
You are now subscribed
Your newsletter sign-up was successful
Want to add more newsletters?

Twice daily
MoneyWeek
Get the latest financial news, insights and expert analysis from our award-winning MoneyWeek team, to help you understand what really matters when it comes to your finances.

Four times a week
Look After My Bills
Sign up to our free money-saving newsletter, filled with the latest news and expert advice to help you find the best tips and deals for managing your bills. Start saving today!
Many gold bugs have long been waiting for The Big Move; when gold gets catapulted somewhere over $2,000, $5,000 or even $10,000 an ounce, as national currencies are debased into oblivion. I am one of them.
With gold's rather stealthy recent move these last few weeks to about $960 an ounce, many from veteran newsletter writer Richard Russell to Goldmoney's James Turk to Comex trader Dan Norcini have turned very bullish. Some have recommended taking leveraged positions, i.e. on borrowed money, declaring in so many words that 'The Big Move' has already begun. I'm not so sure.
I do believe it's coming, but I'm not convinced we're there yet.
MoneyWeek
Subscribe to MoneyWeek today and get your first six magazine issues absolutely FREE

Sign up to Money Morning
Don't miss the latest investment and personal finances news, market analysis, plus money-saving tips with our free twice-daily newsletter
Don't miss the latest investment and personal finances news, market analysis, plus money-saving tips with our free twice-daily newsletter
Gold should reach £2,000 an ounce - but not just yet
We will not reach $5,000 an ounce without some sort of mania. But in the last decade both dotcom and housing, and, to a lesser extent, base metals, uranium and oil, have all shown how easily manias can happen. Manias need a convincing underlying argument - 'internet is a new era', 'there's a shortage of housing', 'the growth of China's middle-class'. And gold's status as a store of value, whether we see inflation or continued deflation, make it an extremely likely candidate in this post-credit-bubble environment. What's more, a great deal of myth and legend follows gold which can only add fuel to the eventual fire.
But, whether we get the mania or not, such are the flaws of UK plc and its monetary representative, the pound, I do see £2,000 an ounce as not just a distinct possibility, but a likelihood.
However, in a mania the world and his wife are buying. At the moment they are not.
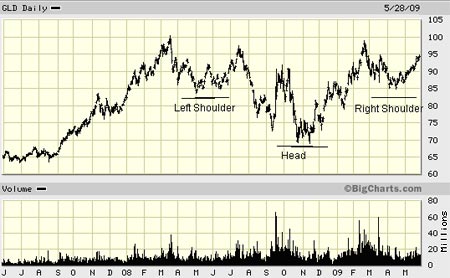
The chart below shows the price in dollars of the SPDR Gold Trust ETF(NYSE:GLD). Ignore the head and shoulder reference for now, I will come to it later, and look at the volume beneath. As you can see, it is not high. In other words this recent move has come on moderate volume. That makes me nervous. If this move had legs, I would like to see higher volume than that.
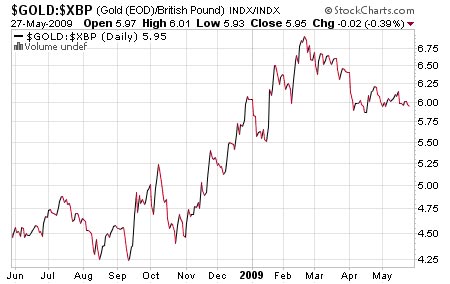
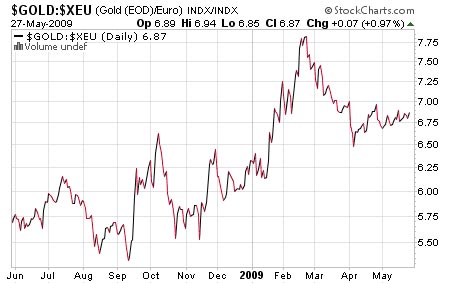
This rally in gold since mid-April has largely been a result of dollar weakness, not increased buying. If you look at the price of gold measured in other currencies - picking the pound and the euro at random, as shown below - you can see it has barely rallied against them at all. If this move were anything more than fluctuating currencies, you would see gold rising against all currencies on higher volume. So don't get too excited just yet.
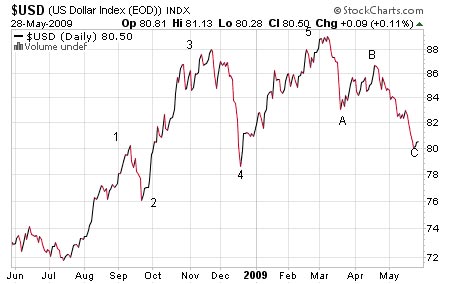
The dollar, meanwhile, is at an inflection point, as are stock markets. It's as though they can't decide which way to turn. If stock markets turn down, money will move out of equities, back to cash and the dollar could rally. If they turn up, the dollar could plummet. Anyone interested in technical analysis, and in particular Elliot waves, will note that the dollar has traced a five-wave up and three-wave down pattern. We are at an obvious point for it to turn up. If it does, gold will most likely pull back.
While we're on the subject of chart patterns, a number of analysts have become very excited about the enormous, bullish inverted head-and-shoulder pattern which gold has mapped out this last year.
What does that mean? It's a chart pattern which often indicates a change in trend, 'a major reversal pattern' says Stockcharts. The head and shoulders suggests a top and the inverted head and shoulders a bottom. Stockcharts describes the inverted version: 'The pattern contains three successive troughs with the middle trough (head) being the deepest and the two outside troughs (shoulders) being shallower.'
Gold has indeed mapped out this pattern, as the GLD chart above shows. This would presage a big move in gold to somewhere over $1200. The volume levels are more or less text book too. But, again, before everyone gets too excited, the formation usually comes at the end of a long downtrend, not at the end of an uptrend as is the case here.
Enjoying this article? Sign up for our free daily email, Money Morning, to receive intelligent investment advice every weekday. Sign up to Money Morning.
Gold miners are making more money
On the other hand, the action in gold stocks, which often lead the metal, has been very bullish and very exciting. I said back in November that gold shares, as opposed to gold itself, would be the best performing asset class of the next few years. This next chart shows the HUI, the index of US-listed gold stocks, over the last three years. There was a lot of resistance between the 300 and 375 levels and the HUI has broken decisively through.
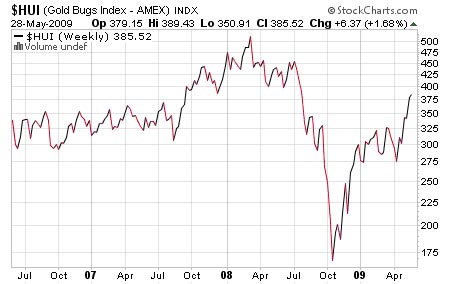
Even without a higher gold price, gold miners are making more money. The cost of labour, energy and equipment are down, which brings their production costs down. If the dollar is strong that further increases their margin. Costs are in local currencies such as the South African rand, the Mexican peso or even the Canadian dollar, while profits are in US dollars.
Even explorers will eventually do well as a greater value will be placed on unmined ore bodies. Another 25% and the HUI will be challenging the all-time highs made in March last year around 500. But I would expect some consolidation first, perhaps between 350 and 400.
In summary, a likely scenario over the next month or three, is for the dollar to rally. That will mean a mild, but healthy pullback for gold, gold stocks and the general stock indices. We can then look for a seasonal summer low in gold some time in the late-June to August timeframe. Then we can look for, if not 'The Big One', 'A Big One'. But, being well positioned on the long side, I'll be only too delighted to be wrong and to see gold's big move come sooner.
Our recommended article for today
Why its still not time to buy property
Despite what many people would have you believe, property in Britain is still too expensive, says Merryn Somerset Webb. With the average person still unable to buy, prices have a lot further to fall yet.
Get the latest financial news, insights and expert analysis from our award-winning MoneyWeek team, to help you understand what really matters when it comes to your finances.
MoneyWeek is written by a team of experienced and award-winning journalists, plus expert columnists. As well as daily digital news and features, MoneyWeek also publishes a weekly magazine, covering investing and personal finance. From share tips, pensions, gold to practical investment tips - we provide a round-up to help you make money and keep it.
-
 Average UK house price reaches £300,000 for first time, Halifax says
While the average house price has topped £300k, regional disparities still remain, Halifax finds.
-
 Barings Emerging Europe trust bounces back from Russia woes
Barings Emerging Europe trust has added the Middle East and Africa to its mandate, delivering a strong recovery, says Max King

