Get the latest financial news, insights and expert analysis from our award-winning MoneyWeek team, to help you understand what really matters when it comes to your finances.
You are now subscribed
Your newsletter sign-up was successful
Want to add more newsletters?

Twice daily
MoneyWeek
Get the latest financial news, insights and expert analysis from our award-winning MoneyWeek team, to help you understand what really matters when it comes to your finances.

Four times a week
Look After My Bills
Sign up to our free money-saving newsletter, filled with the latest news and expert advice to help you find the best tips and deals for managing your bills. Start saving today!
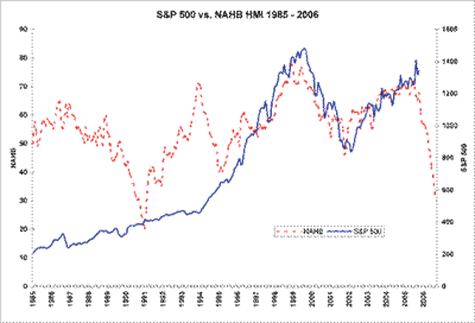
A reader recently sent me an interesting chart that compared the housing industry to the S&P 500 stock index. It clearly showed an incredible correlation between real estate and stocks, and it was so amazing that I got the raw data and plotted the chart myself just to make sure it was real.
The National Association of Home Builders (NAHB) in the US uses a Housing Market Index (HMI) to gauge the single-family housing market. The HMI is based on monthly surveys of NAHB members and includes things such as the present sales of new homes, sales of new homes expected in the next six months and traffic of prospective buyers of new homes. It is therefore a forward-looking instrument.
The HMI is shown on the chart below along with the S&P 500 stock index, which includes 500 of the most widely held US stocks and is a broader proxy for US listed equities than the Dow Jones Industrial Index, which includes only 30 stocks.
MoneyWeek
Subscribe to MoneyWeek today and get your first six magazine issues absolutely FREE

Sign up to Money Morning
Don't miss the latest investment and personal finances news, market analysis, plus money-saving tips with our free twice-daily newsletter
Don't miss the latest investment and personal finances news, market analysis, plus money-saving tips with our free twice-daily newsletter
Given that the HMI is forward looking and that the stock market lags the housing market, the S&P data was shifted forward by one year to show the correlation more clearly. The S&P data follows the HMI data closely from 1995 onward, when massive amounts of foreign capital began to settle in the US, driving down interest rates and fueling the real estate bubble. If we assume that the correlation between the S&P and the housing market will remain strong in the future, this chart portends a major downturn in US equities sometime during the next 12 months as the housing market continues to cool. While I don't expect the S&P to follow the HMI curve down to 600, I would not be surprised to see the S&P correct down to 1000, a level that would put it where we would expect to find it if we continued its moderate increase before 1995.
When I saw this chart I again thought about US consumer spending and GDP. As you know, 70% of US GDP is due to consumer spending and I am of the opinion that the boom in real estate resulted in an increase in consumer spending, which has fueled economic growth. Therefore, if the US real estate market cools off, as it obviously is doing, then we can expect a decline in consumer spending and hence a decline in economic growth.
Here is a chart that shows how the personal consumption expenditures (consumer spending) component of the US GDP varied over time.
This chart shows many interesting things. First of all, notice that from about 1950 to 1982, consumer spending contributed 62.3% to GDP with only minor deviations and, starting around 1982, consumer spending as a percentage of GDP gradually increased.
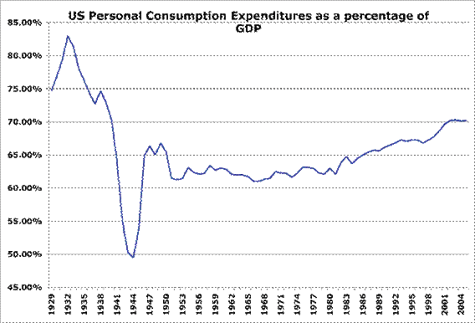
US economic growth was robust since 1982 but still consumer spending as a percentage of GDP was increasing: that means that consumer spending was increasing faster than GDP. It confirms that much of the increase in GDP has been due to the increase in consumer spending. Therefore, if consumer spending were to slow down, economic growth could take a considerable hit.
You probably also noticed that consumer spending declined dramatically during the Great Depression, but the chart above does not tell the whole story. So let us look at actual economic growth and personal consumption after the Crash of 1929.
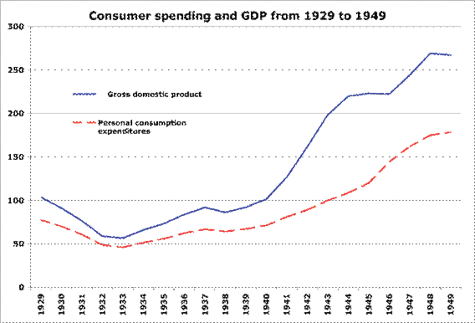
You can see from this data that consumer spending and economic growth both declined after 1929. What you should note is that GDP declined more rapidly than consumer spending. Also notice that GDP increased more rapidly than consumer spending from 1933 and 1937. This is evidence that economic growth is leveraged to consumer spending and therefore a modest decline in consumer spending can have a more dramatic effect on GDP.
The rapid increase in GDP from 1939 to 1944 was due to the Second World War, and was not driven by an increase in consumer spending alone, which is why consumer spending as a percentage of GDP bottomed in 1944 as can be seen in the chart preceding this one. Once everything settled down after the War, consumer spending as a percentage of GDP was relatively constant at 62%, as we mentioned earlier.
The reason for going over all of this is to illustrate that consumer spending is a major driving force for economic growth and that we have seen a drastic increase in consumer spending as a percentage of GDP since 1982, coincident first with a bull market in stocks and bonds and then with a bull market in residential real estate. The residential real estate market is taking a bad beating, as seen in the HMI in the first chart. That should lead to a reduction in consumer spending and because economic growth is leveraged to consumer spending we can reasonably expect a material downturn in economic growth. That should then lead to a decline in stock prices and hence agrees with the prediction of the first chart that there is a real risk of a major downturn in US equities during the next twelve months.
A decline in US economic growth and coincident declines in US equities should make it difficult for the US dollar to sustain its current trading level.
If the dollar falls on foreign exchange markets, as I expect it will, it will translate into higher US dollar gold prices. But, the decline in economic growth will also result in less demand for base metals and hence I believe that we will see the gold price decouple from base metals prices at some point in the near future, with the gold price outperforming base metals prices going forward.
First published on Kitco.com (www.kitco.com)
By Paul van Eeden
Paul van Eeden works primarily to find investments for his own portfolio and shares his investment ideas with subscribers to his weekly investment publication. For more information please visit his website (www.paulvaneeden.com). If you would like to read more from Paul, you can sign up to get his weekly commentary at https://www.paulvaneeden.com/commentary.php.
Get the latest financial news, insights and expert analysis from our award-winning MoneyWeek team, to help you understand what really matters when it comes to your finances.
MoneyWeek is written by a team of experienced and award-winning journalists, plus expert columnists. As well as daily digital news and features, MoneyWeek also publishes a weekly magazine, covering investing and personal finance. From share tips, pensions, gold to practical investment tips - we provide a round-up to help you make money and keep it.
-
 MoneyWeek Talks: The funds to choose in 2026
Podcast Fidelity's Tom Stevenson reveals his top three funds for 2026 for your ISA or self-invested personal pension
-
 Three companies with deep economic moats to buy now
Opinion An economic moat can underpin a company's future returns. Here, Imran Sattar, portfolio manager at Edinburgh Investment Trust, selects three stocks to buy now
-
 Canada will be a winner in this new era of deglobalisation and populism
Greg Eckel, portfolio manager at Canadian General Investments, selects three Canadian stocks
-
 US inflation brings no respite for markets
News As US inflation hit a 40-year high, the benchmark S&P 500 stockmarket index slid into a bear market, down more than 20% since its 3 January high.
-
 Central banks change their tune on inflation
News With prices rising at 7.9% in the US and 6.2% in the UK, and global commodity prices surging, central banks around the world are being forced into inflation-fighting mode.
-
 Interest rates might rise faster than expected – what does that mean for your money?
Analysis The idea that the US Federal Reserve could raise interest rates much earlier than anticipated has upset the markets. John Stepek explains why, and what it means for you.
-
 Quiz of the week 21-27 November
Features Test your recollection of the events of the last seven days with MoneyWeek's quiz of the week.
-
 A. Gary Shilling: a recession is coming
Features A. Gary Shilling was among the few investors to correctly predict a lengthy stagnation in the wake of the financial crisis. Now he's warning of a recession.
-
 The world’s greatest investors: Bill Nygren
Features Nygren is a value investor who looks for companies that he thinks are trading below what he considers to be their intrinsic value.
-
 Buffett’s bet: can a tracker trounce the hedgies?
Features There’s no sense in handing 1%-2% plus fees to fund managers when a cheap tracker gets results, says Stephen Connolly.

