Get the latest financial news, insights and expert analysis from our award-winning MoneyWeek team, to help you understand what really matters when it comes to your finances.
You are now subscribed
Your newsletter sign-up was successful
Want to add more newsletters?

Twice daily
MoneyWeek
Get the latest financial news, insights and expert analysis from our award-winning MoneyWeek team, to help you understand what really matters when it comes to your finances.

Four times a week
Look After My Bills
Sign up to our free money-saving newsletter, filled with the latest news and expert advice to help you find the best tips and deals for managing your bills. Start saving today!
Charts will always tell you when the primary trend changes. This is nowhere better illustrated than in the behaviour of currencies.
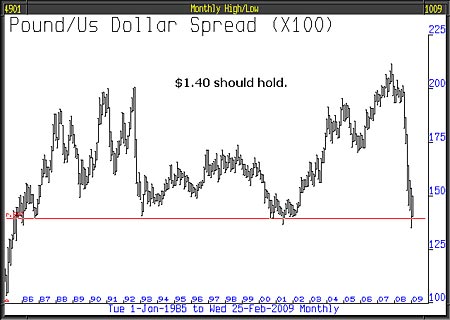
The pound, particularly against the US dollar, suffered an important setback starting in August last year. In previous issues we said that the level of $1.40 was a long-term support level that we expected to hold and so far, that is the case. We can now be comfortable in making the following observation.
On the pound strengthening, which we expect, above $1.50 the reversal is confirmed and only if we suffer weakness below $1.40 again would we deem there to be any risk from holding sterling. In fact, we are quietly confident that sterling against the US dollar has embarked upon a new strengthening period.
MoneyWeek
Subscribe to MoneyWeek today and get your first six magazine issues absolutely FREE

Sign up to Money Morning
Don't miss the latest investment and personal finances news, market analysis, plus money-saving tips with our free twice-daily newsletter
Don't miss the latest investment and personal finances news, market analysis, plus money-saving tips with our free twice-daily newsletter
Assuming sterling does strengthen from here, then above $1.58, we would become very bullish indeed and very bearish about the dollar about which anyway, we have very poor expectations. Obama's team will find themselves like King Canute, unable to make the tide change its direction, and in their endeavours to fight that natural force, create just too many dollars for the world's comfort.

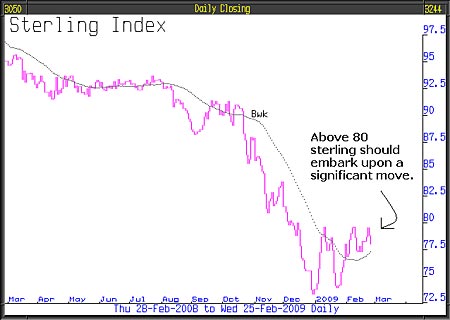
The short-term chart of the Sterling Index adds support to our view, just by looking at it you can see that an important short-term bottom formed in January. Above 80, our expectations of pound strength will be magnified considerably.

Charts are valuable no matter what asset class you are looking at. When it comes to currencies, which are almost exclusively traded on charts rather than fundamentals, they tend to be a extremely effective.
Going into the investment markets without the charts is just as foolish as going into the Amazon jungle without a map and compass; you will get lost, perish and probably eaten! Those with the map and compass take the photographs, and come back safely. They then write the book, are invited to chat shows and finish off famous and rich. The downside of studying the charts is that it's unremitting hard work that many are not willing to embrace.
This article was written by Full Circle Asset Management, and published in the threesixty Newsletter on 27 February 2009.
Get the latest financial news, insights and expert analysis from our award-winning MoneyWeek team, to help you understand what really matters when it comes to your finances.
MoneyWeek is written by a team of experienced and award-winning journalists, plus expert columnists. As well as daily digital news and features, MoneyWeek also publishes a weekly magazine, covering investing and personal finance. From share tips, pensions, gold to practical investment tips - we provide a round-up to help you make money and keep it.
-
 Average UK house price reaches £300,000 for first time, Halifax says
While the average house price has topped £300k, regional disparities still remain, Halifax finds.
-
 Barings Emerging Europe trust bounces back from Russia woes
Barings Emerging Europe trust has added the Middle East and Africa to its mandate, delivering a strong recovery, says Max King

