The euro trades below 1.30 – will it bounce?
The euro has followed the script and continued on its downward course. But could there be a bump in the road? John C Burford inspects the charts for clues.
Get the latest financial news, insights and expert analysis from our award-winning MoneyWeek team, to help you understand what really matters when it comes to your finances.
You are now subscribed
Your newsletter sign-up was successful
Want to add more newsletters?

Twice daily
MoneyWeek
Get the latest financial news, insights and expert analysis from our award-winning MoneyWeek team, to help you understand what really matters when it comes to your finances.

Four times a week
Look After My Bills
Sign up to our free money-saving newsletter, filled with the latest news and expert advice to help you find the best tips and deals for managing your bills. Start saving today!
We are seeing new highs in the Dow this week and I hope to cover this on Friday and show you an interesting pair of tramlines I am working on.
But today, I wish to focus on the euro, which I last covered on 20 February.
Here, I have seen a classic case of tramline failure and a lesson in deciding when is the right time to abandon your current set-up and look for a new one.
MoneyWeek
Subscribe to MoneyWeek today and get your first six magazine issues absolutely FREE

Sign up to Money Morning
Don't miss the latest investment and personal finances news, market analysis, plus money-saving tips with our free twice-daily newsletter
Don't miss the latest investment and personal finances news, market analysis, plus money-saving tips with our free twice-daily newsletter
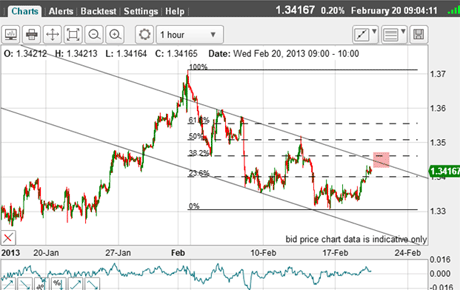
Last time, I showed the current hourly chart with my down-sloping tramlines (below).
The market had just hit my 1.34 rally target and was going for the area of the pink zone as a possible upper target.
(Click on the chart for a larger version)
Since the trend was decidedly down, I was looking for a short entry. To avoid disappointment, a short trade could have been taken right there at 1.3416 with a stop above the upper tramline.
Or, a trader could wait for the move to the tramline and enter a short trade there. The protective stop could then be set closer to entry and a lower-risk trade carried than the first. This is desirable, of course.
How a professional should act
But as it happened, the market never made it to the tramline and resumed its decline. So the first tactic resulted in a trade, while the second tactic left the trader empty-handed.
So what would be the reaction of this trader to seeing a profitable tradethat they had been stalking slip from their grasp and see the market move in the direction they had forecast? How would you react? Frustration? Anger? Disgust?
A professional would feel some or all of these feelings, but would quickly wipe away that experience and begin anew. Never believe that professionals do not feel strong emotions such as these. The difference is that they know from experience how to handle them and get back on track.
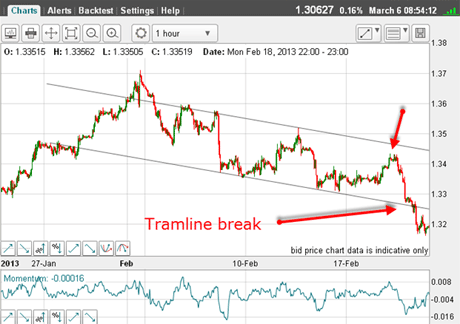
Here is the chart showing the rally to the 1.34 area (red arrow) and the subsequent crash below the lower tramline.
Remember, this action was on the cards, since bullish opinion was so strong. In fact, at one time, bullish consensus reached a record-breaking 97%!
(Click on the chart for a larger version)
So far, my tramlines were operating, but let's fast forward to this morning:
(Click on the chart for a larger version)
Is there a long-trade on the euro?
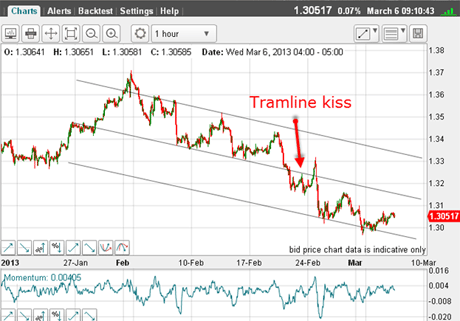
Right after the tramline break, the market came back to the underside of the lower (now centre) tramline for a classic kiss', but then after an initial break, caught a bid and rallied right up into the trading channel.
Recall that tramline kisses are usually great places to make a trade.
Then, heavy selling brought the market back below the tramline and hit the third tramline on the button.
This spike action up inside the trading channel and back down is a signal that my tramlines are losing their power. I had better start looking for a breakdown.
This move to the 1.30 level was a good place to take a short-term profit, of course.
And there was a second bite of the cherry as the market came back again to trade below the 1.30 level.
But with the market at the third tramline, is there a long trade here? After all, the descent from the 1.37 level has taken only a month. Let's take a closer look:
(Click onthe chartfor alarger version)
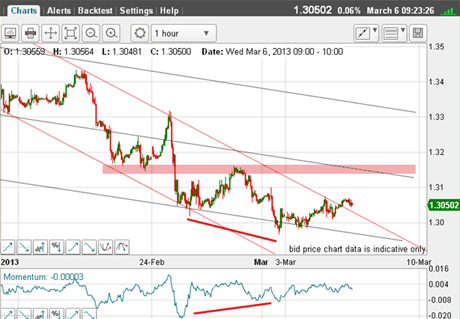
There is a clear positive-momentum divergence at the low and I have a good down-sloping tramline pair (in red), with a potential break of the upper line currently.
A long trade here would make sense, as a close stop could be employed and an initial target where the pink zone of resistance meets the centre (black) tramline.
Breaking that resistance would then set a target in the 1.33 area, where the upper tramline lies.
But in the background, of course, is the long-term euro bear market:
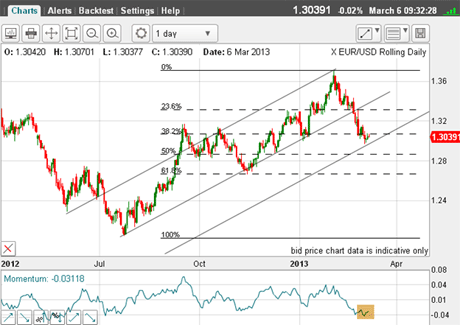
(Click on the chart for a larger version)
Here are my long-term tramlines and the market at 1.30 has declined to the third lower tramline, and has slightly overshot the Fibonacci 38% retrace. Also, daily momentum is oversold.
To me, the odds do favour a bounce of some sort, and maybe I will see the 1.33 level hit in the next few days.
Long-term traders will be holding their short positions, of course.
If you're a new reader, or need a reminder about some of the methods I refer to in my trades, then do have a look at my introductory videos:
The essentials of tramline trading
An introduction to Elliott wave theory
Advanced trading with Elliott waves
Don't miss my next trading insight. To receive all my spread betting blog posts by email, as soon as I've written them, just sign up here . If you have any queries regarding MoneyWeek Trader, please contact us here.
Get the latest financial news, insights and expert analysis from our award-winning MoneyWeek team, to help you understand what really matters when it comes to your finances.
John is is a British-born lapsed PhD physicist, who previously worked for Nasa on the Mars exploration team. He is a former commodity trading advisor with the US Commodities Futures Trading Commission, and worked in a boutique futures house in California in the 1980s.
He was a partner in one of the first futures newsletter advisory services, based in Washington DC, specialising in pork bellies and currencies. John is primarily a chart-reading trader, having cut his trading teeth in the days before PCs.
As well as his work in the financial world, he has launched, run and sold several 'real' businesses producing 'real' products.
-
 Inheritance tax investigations net HMRC an extra £246m from bereaved families
HMRC embarked on almost 4,000 probes into unpaid inheritance tax in the year to last April, new figures show, in an increasingly tough crackdown on families it thinks have tried to evade their full bill
-
 Average UK house price reaches £300,000 for first time, Halifax says
While the average house price has topped £300k, regional disparities still remain, Halifax finds.