What does bitcoin mania teach us about the Dow?
The phenomenal rise in the bitcoin was only beaten by the digital currency's spectacular crash. Should Dow traders take note? John C Burford surveys the charts for clues.
Get the latest financial news, insights and expert analysis from our award-winning MoneyWeek team, to help you understand what really matters when it comes to your finances.
You are now subscribed
Your newsletter sign-up was successful
Want to add more newsletters?

Twice daily
MoneyWeek
Get the latest financial news, insights and expert analysis from our award-winning MoneyWeek team, to help you understand what really matters when it comes to your finances.

Four times a week
Look After My Bills
Sign up to our free money-saving newsletter, filled with the latest news and expert advice to help you find the best tips and deals for managing your bills. Start saving today!
Bitcoin, the digital currency, was on the cover of the FT last week. It's a terrific example of how widespread attention and the mass media eventually pop' a price bubble.
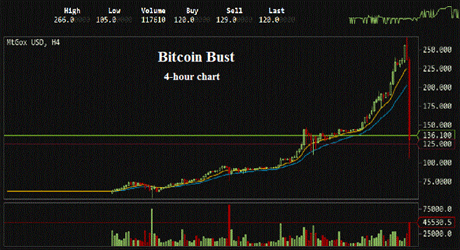
Bitcoin's value rocketed just this year by many multiples, and on Wednesday, the market crashed by a stunning Fibonacci 62% in a couple of hours (the red bar on the right in the below chart).
I had been monitoring the press coverage of bitcoin and noted the mania surrounding it was getting more intense. It is positioned as an alternative to fiat currencies.
MoneyWeek
Subscribe to MoneyWeek today and get your first six magazine issues absolutely FREE

Sign up to Money Morning
Don't miss the latest investment and personal finances news, market analysis, plus money-saving tips with our free twice-daily newsletter
Don't miss the latest investment and personal finances news, market analysis, plus money-saving tips with our free twice-daily newsletter
Apparently the Russians love it totally understandable following the recent treatment of their Cyprus bank deposits.
This is reminiscent of the situation in gold in 2011, as it approached the $2,000 level. Then, bullish enthusiasm was similarly off the scale.

(Click on the chart for a larger version)
The chart also illustrates the old maxim that markets fall out of the window faster than they climb the stairs.
This market was almost entirely speculative apparently, few bitcoins have been used in commerce and interestingly, they are bought for cash with no leverage unlike the financial markets.
Even so, when many try to abandon ship at the same time, they capsize the market quickly enough to crash the servers.
The larger question is this: is the bitcoin collapse the canary in the coal mine for all asset markets, indicating a more general switch from 'risk-on' to 'risk-off'? Or is this just a one-off in a very thin and non-shortable market?
I subscribe to the idea that markets are driven by mass social mood or sentiment. And once the mood begins to reverse, markets turn in sequence, one after the other.
With this debacle in mind, let me turn to the Dow, which has been flying of late.
Amazing climb in the Dow
As a long-term bear, I have been amazed at the market's relentless recent climbs. As a measure of that worry, here are just a few recent titles in seekingalpha.com articles which give a flavour of the skepticism out there:
Threereasons why stocks could plunge
Dow Jones Industrial Average about to plunge?
Have S&P 500 earnings peaked out?
Daily state of the markets: things are looking dicey
There are many others, but you get the idea.
And the latest AAII.com survey also shows massive negativity in retail-land:
| Bulls | 19% | -16% | 39 |
| Bears | 55% | +26% | 30 |
| Neutral | 26% | -10% | 31 |
This is a huge swing to the bearish camp and in just one week.
Of course, with such doubt prevalent in the market, many are shorting into the rally, searching for the elusive top. And so far, they are being crushed.
My view is that the wall of worry' is so high and possibly climbing that stocks will have difficulty making a lasting top.
On the way up I put out a few shorts, but either exited at break-even or took a small loss, well within my 3% rule limits.
But this public bearishness is matched by an equal and opposite bullishness from the professionals.
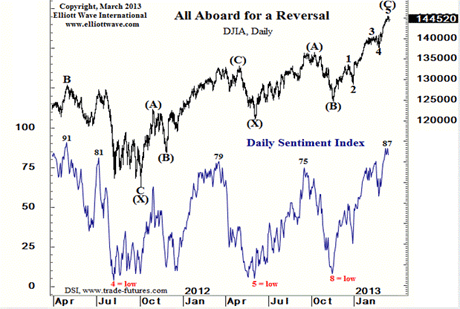
Here is a recent chart showing the Daily Sentiment Index from trade-futures.com, who survey professional financial advisors:

(Source: elliotwave.com - click on the chart for a larger version)
Bullishness is at record highs.
Incidentally - observe how the degree of bullishness swings up and down with the market.
So the battle lines are drawn: the pros are super-bullish while the folks are super-bearish.
This huge degree of divisive opinion is very unusual. To me, it indicates that when the market turns, the moves will be historic.
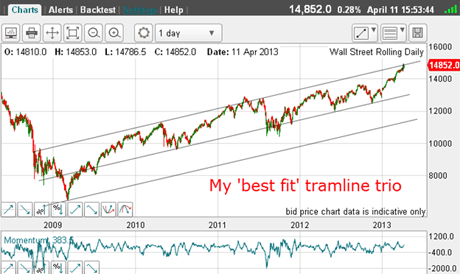
OK, I have an interesting long-term tramline pair working:

(Click on the chart for a larger version)
And now, the market is up against the upper line. Note that in the past four-plus years, the market has failed to break decisively above it, except for a brief overshoot in the summer of 2011.
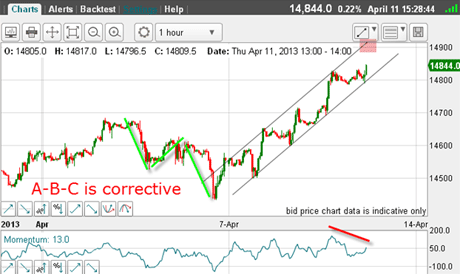
Also, I have a short-term tramline pair working:

(Click on the chart for a larger version)
The market has been rising along these tramlines all week, although without prior pivot points(PPPs), I do not consider them too reliable. But they are all I have for now.
Prior to these tramlines, the market made a classic A-B-C corrective pattern, which heralded a rally continuation.
The next target is the upper tramline in the 14,900 area.
But note the position of the momentum indicator. In order to erase the negative-momentum divergence, the market will need to scoot smartly towards this target.
If it does not, then there is the potential for a down move if the lower tramline is broken and the negative-momentum divergence will hold.
And if this occurs, it could be the start of a much larger move down.
I shall be on the alert for a tramline break.
But all bulls should glance over at the bitcoin chart before they become too complacent. They have had it their own way for a very long time and all good things come to an end eventually.
If you're a new reader, or need a reminder about some of the methods I refer to in my trades, then do have a look at my introductory videos:
The essentials of tramline trading
An introduction to Elliott wave theory
Advanced trading with Elliott waves
Don't miss my next trading insight. To receive all my spread betting blog posts by email, as soon as I've written them, just sign up here . If you have any queries regarding MoneyWeek Trader, please contact us here.
Get the latest financial news, insights and expert analysis from our award-winning MoneyWeek team, to help you understand what really matters when it comes to your finances.
John is is a British-born lapsed PhD physicist, who previously worked for Nasa on the Mars exploration team. He is a former commodity trading advisor with the US Commodities Futures Trading Commission, and worked in a boutique futures house in California in the 1980s.
He was a partner in one of the first futures newsletter advisory services, based in Washington DC, specialising in pork bellies and currencies. John is primarily a chart-reading trader, having cut his trading teeth in the days before PCs.
As well as his work in the financial world, he has launched, run and sold several 'real' businesses producing 'real' products.
-
 Can mining stocks deliver golden gains?
With gold and silver prices having outperformed the stock markets last year, mining stocks can be an effective, if volatile, means of gaining exposure
-
 8 ways the ‘sandwich generation’ can protect wealth
People squeezed between caring for ageing parents and adult children or younger grandchildren – known as the ‘sandwich generation’ – are at risk of neglecting their own financial planning. Here’s how to protect yourself and your loved ones’ wealth.