Profit from the Dow Jones - whichever way it heads
With recent falls suggesting the Dow Jones's bull run may be ending, John C Burford examines the charts, and looks for potential trades whichever way the market goes now.
Get the latest financial news, insights and expert analysis from our award-winning MoneyWeek team, to help you understand what really matters when it comes to your finances.
You are now subscribed
Your newsletter sign-up was successful
Want to add more newsletters?

Twice daily
MoneyWeek
Get the latest financial news, insights and expert analysis from our award-winning MoneyWeek team, to help you understand what really matters when it comes to your finances.

Four times a week
Look After My Bills
Sign up to our free money-saving newsletter, filled with the latest news and expert advice to help you find the best tips and deals for managing your bills. Start saving today!
Last Friday, I wrote on the morning before the release of the dreadful US employment report, which must have shaken the stock bulls: The secret of successful trading: have a system and stick to it.
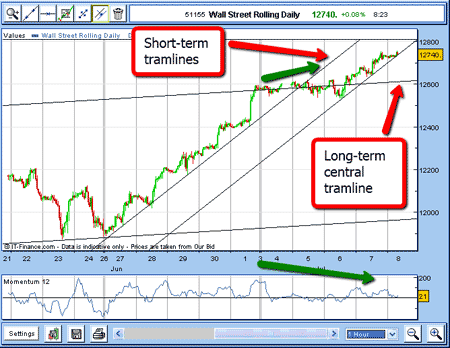
Recall, in the morning, the Dow was trading at or around my short-term tramline:

(Click on the chart for a larger version)
MoneyWeek
Subscribe to MoneyWeek today and get your first six magazine issues absolutely FREE

Sign up to Money Morning
Don't miss the latest investment and personal finances news, market analysis, plus money-saving tips with our free twice-daily newsletter
Don't miss the latest investment and personal finances news, market analysis, plus money-saving tips with our free twice-daily newsletter
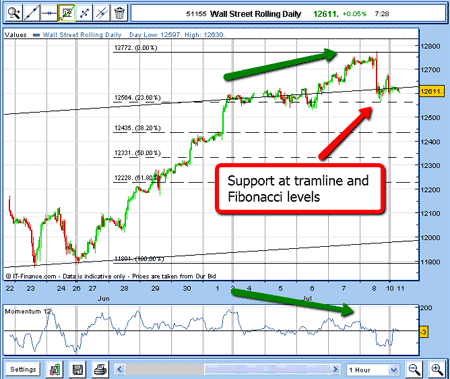
To me, it looked vulnerable to a break and that is exactly what we got later that day. Here is the latest chart:

(Click on the chart for a larger version)
The key for me was the potential textbook five-wave Elliott wave pattern that was forming.
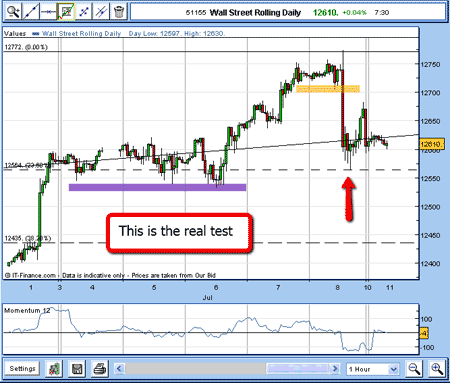
The break of my short-term tramline at the 12,730 area confirmed the end of the rally (marked by the yellow bar).
In the afternoon, the market dropped rapidly to an important level where there was significant support.
The Dow hits support - but will it hold?
So now, we have a major test of support. If that gives way, the odds dramatically shift to the view that the top is being formed.

(Click on the chart for a larger version)
On Friday, I had two scenarios. If I were a more adventurous trader I could have short the market on a break of the short-term tramline at the 12,710 area (yellow bar on the chart).
The other scenario was if I were a more conservative trader, who would want more confirmation of a trend-change, to wait for a clear break of the major support provided by my central tramline before pulling the trigger (marked by the purple bar).
Incidentally, in a very pretty confirmation of how the Dow adheres closely to Fibonacci retracements, look at the exact point of support at the 23.8% retracement at 12,564 from where the market bounced (red arrow in the above chart).
Again, this is textbook stuff.
Even if I ignored the Fibonacci picture, as an experienced trader I would have expected some support in this area simply because of the trading congestion from last Monday to Wednesday.
Prices were confined to a narrow zone on those days.
That meant that there were traders who positioned themselves short and were staring at a loss as the market rallied on Thursday and Friday morning.
When the market broke back on Friday afternoon, they grabbed the opportunity to cover their short trades to limit losses, and their buying helped the market to stabilise.
There are two ways the market could go now
But now, at support, where is the Dow heading? That is the question. Let's assess the evidence.
Here is the first clue that the trend has changed.
I have a beautifully complete Elliott wave five-wave count to the top at 12,770 on Friday complete with a negative momentum divergence.
I also have a clear break of my minor tramline at the 12,710 area, and on the long-term charts, I see massive resistance at 12,700 + or 100.
If my central tramline still has any validity, a good break here would give me another strong clue. Ideally, I would want this to happen soon within hours.
But, as ever, there is another side to this coin!
I have painted an ideal scenario for a bear, and so far so good. But what if the market hasn't finished its rally?
Because anything is possible in the markets (but not everything is probable!), I must consider the possibility that the rally is intact.
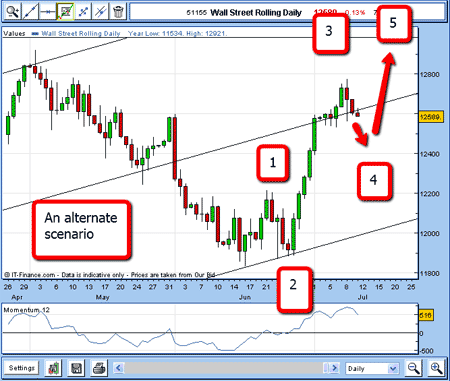
Here is an alternative forecast:

(Click on the chart for a larger version)
In this scenario, wave 5 may well be a wave 3, and the current correction may be forming a wave 4 before running higher to new highs in a wave 5.
The overbought momentum readings are currently being corrected, so this scenario is possible.
I shall have to wait and see what the market provides for me, but in the meantime, a short trade in the 12,710 area can be protected by moving stops to break-even (following my break-even rule.)
Conservative traders will be looking at the 12,550 level with interest!
Don't miss my next trading insight. To receive all my spread betting blog posts by email, as soon as I've written them, just sign up here .
Get the latest financial news, insights and expert analysis from our award-winning MoneyWeek team, to help you understand what really matters when it comes to your finances.
John is is a British-born lapsed PhD physicist, who previously worked for Nasa on the Mars exploration team. He is a former commodity trading advisor with the US Commodities Futures Trading Commission, and worked in a boutique futures house in California in the 1980s.
He was a partner in one of the first futures newsletter advisory services, based in Washington DC, specialising in pork bellies and currencies. John is primarily a chart-reading trader, having cut his trading teeth in the days before PCs.
As well as his work in the financial world, he has launched, run and sold several 'real' businesses producing 'real' products.
-
 Average UK house price reaches £300,000 for first time, Halifax says
While the average house price has topped £300k, regional disparities still remain, Halifax finds.
-
 Barings Emerging Europe trust bounces back from Russia woes
Barings Emerging Europe trust has added the Middle East and Africa to its mandate, delivering a strong recovery, says Max King