This wedge pattern says the FTSE is about to spasm violently
Britain's benchmark index, the FTSE 100, has reached a set of crossroads in the charts, says John C Burford.
Get the latest financial news, insights and expert analysis from our award-winning MoneyWeek team, to help you understand what really matters when it comes to your finances.
You are now subscribed
Your newsletter sign-up was successful
Want to add more newsletters?

Twice daily
MoneyWeek
Get the latest financial news, insights and expert analysis from our award-winning MoneyWeek team, to help you understand what really matters when it comes to your finances.

Four times a week
Look After My Bills
Sign up to our free money-saving newsletter, filled with the latest news and expert advice to help you find the best tips and deals for managing your bills. Start saving today!
There's something weird about the FTSE 100 right now.
In all of my years of trading, I've never seen a stronger example of 'resistance' (where a market is unable to rise higher than a specific value) than I'm seeing in the FTSE right now.
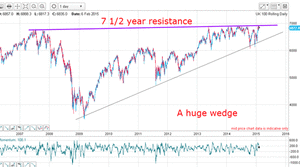
The FTSE index looked like it would first rise above the magic 7,000 level in 1999, during the dotcom boom. That boom turned to a bust, and the market fell away. The market gradually rose again to 7,000 in 2007, only to bounce off it a few times and then fall back after the 2008 crash.
MoneyWeek
Subscribe to MoneyWeek today and get your first six magazine issues absolutely FREE

Sign up to Money Morning
Don't miss the latest investment and personal finances news, market analysis, plus money-saving tips with our free twice-daily newsletter
Don't miss the latest investment and personal finances news, market analysis, plus money-saving tips with our free twice-daily newsletter
Since 2013, the FTSE has tested that 7,000 number over and over again, but it bounces back down every single time.
Just look at the chart below. The seven and a half year old line of resistance really stands out, doesn't it?

This resistance at 7,000 is one part of a 'wedge' pattern. The other half of the wedge is the support line, which begins at the 2009 low.
As you know, the wedge is one of my favourite patterns and this one is a doozy, lasting almost six years. Wedge patterns are important because when a market eventually breaks out of a wedge pattern, it normally breaks out in a strong, decisive way violently up or down.
In other words, something's got to give.
Either the FTSE will finally surge through the 7,000 level, after 15 years of trying. Or we're in for a serious crash.
I'm using Elliott waves to pinpoint the turn
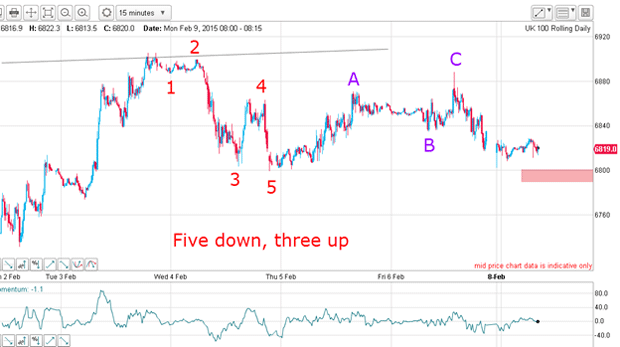
Time to zoom in and take a closer look.

This is highly significant, because a five-wave Elliott-wave pattern normally indicates that the trend is about to change.
This five-wave pattern had some signature Elliott wave characteristics: wave 3 is long and strong, and wave 4 does not go higher than the price levels of wave 1. It ticks all the boxes.
And after that low (at the red wave 5 on my chart), the Elliott-wave patterns kept on coming. The rally from the low formed a textbook Elliott-wave A-B-C pattern.
So once again, I have all the evidence I need to strongly suggest the trend has changed.
Here's how I'm trading it
My analysis has shown me the best place to make low-risk trades. But what about if I'm wrong? Well, that's where risk management comes into play.
I always use stop-losses to limit the amount I can lose in any one trade. And I use my 3% rule to determine exactly where to place my stop-loss (my 3% rule says that you set your stop-loss in such a way that your maximum loss from each trade is equal to 3% of your total trading capital).
That way, whatever the market does from here, I am trading with the odds on my side. That is what the pros do and over time, if my analysis is right, I'll win more than I lose.
A final thought
To some, that would be a devastating outcome. That's an understandable response. But as a trader, it's a terrible mistake. You should never allow your emotions to cloud your judgment in that way.
Every morning is a new day. Keep analysing your charts with the updated action, and never be afraid to change your mind.
Nimble traders are usually the most successful.
Get the latest financial news, insights and expert analysis from our award-winning MoneyWeek team, to help you understand what really matters when it comes to your finances.
John is is a British-born lapsed PhD physicist, who previously worked for Nasa on the Mars exploration team. He is a former commodity trading advisor with the US Commodities Futures Trading Commission, and worked in a boutique futures house in California in the 1980s.
He was a partner in one of the first futures newsletter advisory services, based in Washington DC, specialising in pork bellies and currencies. John is primarily a chart-reading trader, having cut his trading teeth in the days before PCs.
As well as his work in the financial world, he has launched, run and sold several 'real' businesses producing 'real' products.
-
 Barings Emerging Europe trust bounces back from Russia woes
Barings Emerging Europe trust has added the Middle East and Africa to its mandate, delivering a strong recovery, says Max King
-
 How a dovish Federal Reserve could affect you
Trump’s pick for the US Federal Reserve is not so much of a yes-man as his rival, but interest rates will still come down quickly, says Cris Sholto Heaton