This is a huge week for the Dow Jones
The Dow has reached a decisive crossroad in the charts. John C Burford uses his trading methods to weigh his options.
Get the latest financial news, insights and expert analysis from our award-winning MoneyWeek team, to help you understand what really matters when it comes to your finances.
You are now subscribed
Your newsletter sign-up was successful
Want to add more newsletters?

Twice daily
MoneyWeek
Get the latest financial news, insights and expert analysis from our award-winning MoneyWeek team, to help you understand what really matters when it comes to your finances.

Four times a week
Look After My Bills
Sign up to our free money-saving newsletter, filled with the latest news and expert advice to help you find the best tips and deals for managing your bills. Start saving today!
Today is the Labour Day holiday in the USA but don't expect US markets to be sleepy! Markets are often just as volatile in these periods and can be more so because trading volumes are generally a lot lower. And a lot can happen on the long weekend that moves markets, particularly when Asian markets are open and influence our own markets.
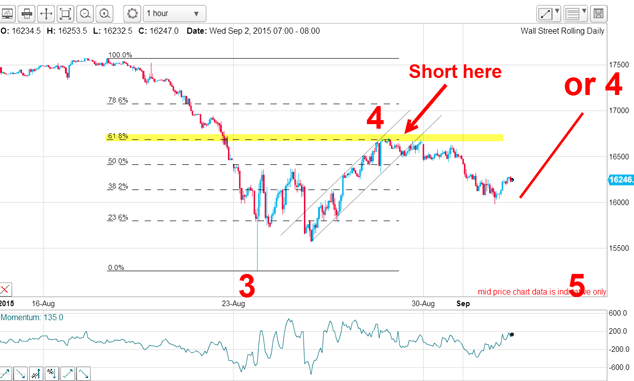
In my postof last Wednesday, I explained how I had captured a terrific trade in the Dow using my usual tramline methods. That trade was entered on our Bank Holiday when markets were far from uninteresting. We were still in wave 4 up off the plunge low of Black Monday. But the twists and turns within fourth waves can be very tricky to forecast and that is why I had two options for the market marked on the chart.
This was the hourly Dow chart on Wednesday:
MoneyWeek
Subscribe to MoneyWeek today and get your first six magazine issues absolutely FREE

Sign up to Money Morning
Don't miss the latest investment and personal finances news, market analysis, plus money-saving tips with our free twice-daily newsletter
Don't miss the latest investment and personal finances news, market analysis, plus money-saving tips with our free twice-daily newsletter

On the other hand, third waves are a pure joy to trade if you can catch them early enough.
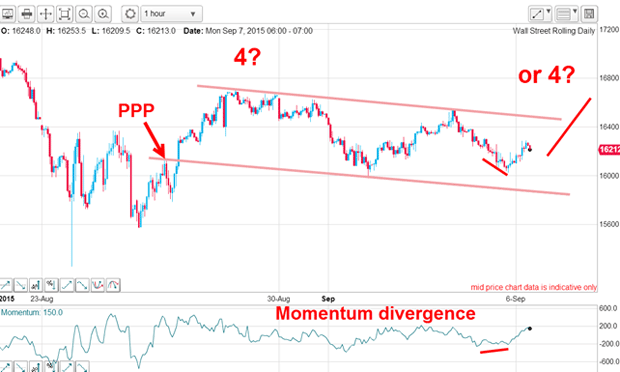
On the chart this morning I have a pretty good tramline pair with the upper tramline having four touch points. Although the lower tramline has only one touch point so far, it does have a nice prior pivot point (PPP) and that makes it reasonably reliable as a line of support:

On Friday, the market declined to test the 16,000 low, but did not break past it. That could be significant because the positive-momentum divergence at Friday's low indicated that selling pressure was drying up. That leads to the possibility that more buying could enter and push the market up and towards the upper tramline.
If this does occur, then a possible break of the upper tramline would set up a scenario whereby the market could rally on past my old wave 4 high and make a new one.
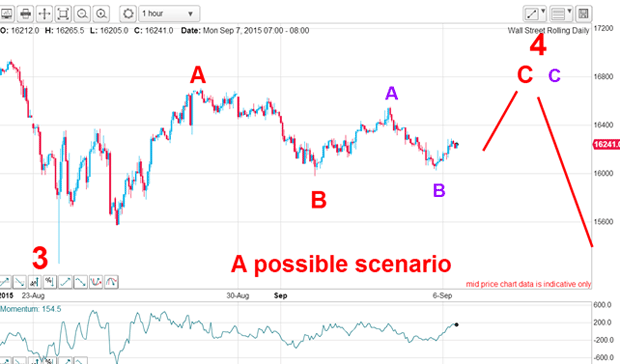
What would that scenario look like?
On the chart below the current rally is seen as the purple wave C of red wave C. This could take the market to values above the red A wave high at the 17,000 area.
But when these suggested waves top out in my new wave 4, the move down in red wave 5 would start and draw prices towards the wave 3 low:

For this scenario to play out, the market must hit the key level of the purple wave C high.
But a break of the purple B wave low would confirm the wave 4 top was in and that the downtrend was in full force.
However, it is much more likely that the market will not make breakouts from these levels in the next few days because on Thursday, the monthly Fed pronouncements are to be released. It is widely expected that they will announce a tiny 0.25% Fed Funds rate increase, so that is probably in the market already.
Any deviation from that would almost certainly make for a very excited market.
My best guess is that the 0.25% rate increase will be announced on Thursday with suitable 'don't frighten the horses' words to allay fears for further increases before late 2016 at the earliest. If this occurs, I believe stocks will rally possibly hard.
But with this widely-anticipated event on Thursday, many traders will be squaring positions, making wide swings both up and down almost certain this week.
For a small trader, lightening positions is almost always the best policy for short-term trades.
Many traders are also holding short positions from the 17,500 area or above as longer-term plays. These positions will not be shaken out while the market decides when wave 4 has ended. They will have break-even stop losses attached, so they are in a very enviable no-lose situation.
So far, the current fourth wave in the Dow is living up to its type presenting a very tricky trading environment where caution is best observed.
Get the latest financial news, insights and expert analysis from our award-winning MoneyWeek team, to help you understand what really matters when it comes to your finances.
John is is a British-born lapsed PhD physicist, who previously worked for Nasa on the Mars exploration team. He is a former commodity trading advisor with the US Commodities Futures Trading Commission, and worked in a boutique futures house in California in the 1980s.
He was a partner in one of the first futures newsletter advisory services, based in Washington DC, specialising in pork bellies and currencies. John is primarily a chart-reading trader, having cut his trading teeth in the days before PCs.
As well as his work in the financial world, he has launched, run and sold several 'real' businesses producing 'real' products.
-
 ISA fund and trust picks for every type of investor – which could work for you?
Whether you’re an ISA investor seeking reliable returns, looking to add a bit more risk to your portfolio or are new to investing, MoneyWeek asked the experts for funds and investment trusts you could consider in 2026
-
 The most popular fund sectors of 2025 as investor outflows continue
It was another difficult year for fund inflows but there are signs that investors are returning to the financial markets