The tide has turned for gold
John C Burford is confident that gold's bull run is coming to an end, and now it’s time to short the yellow metal. Here, he explains why.
Get the latest financial news, insights and expert analysis from our award-winning MoneyWeek team, to help you understand what really matters when it comes to your finances.
You are now subscribed
Your newsletter sign-up was successful
Want to add more newsletters?

Twice daily
MoneyWeek
Get the latest financial news, insights and expert analysis from our award-winning MoneyWeek team, to help you understand what really matters when it comes to your finances.

Four times a week
Look After My Bills
Sign up to our free money-saving newsletter, filled with the latest news and expert advice to help you find the best tips and deals for managing your bills. Start saving today!
Yesterday's developments in the gold (and silver) markets have been absolutely crucial to allowing me to call the top with a high degree of confidence. So I've decided to send out this special update on yesterday's email: Is gold heading for a reversal?
One key to my bold stance is the ongoing Elliott wave patterns I am seeing play out in textbook fashion in both the long-term charts and in the very short-term.
Now, I do not call tops (and bottoms) in virtually real time at all casually. Having egg on my face is not a pleasant feeling!
MoneyWeek
Subscribe to MoneyWeek today and get your first six magazine issues absolutely FREE

Sign up to Money Morning
Don't miss the latest investment and personal finances news, market analysis, plus money-saving tips with our free twice-daily newsletter
Don't miss the latest investment and personal finances news, market analysis, plus money-saving tips with our free twice-daily newsletter
This gold bull market is a decades-long affair and all traders must respect that. There is no doubt that trading it from the long side has been the correct stance for many years.
But all trends do eventually end nothing flies to the moon (despite the forecasts of many bulls calling for $2,500 an ounce, $5,000, and even higher).
The common human response is to become more bullish as new highs are being made. Yesterday, I showed how super-bullish the hedge fund managers have become.
But this is a big mistake.
The savvy trader will be looking for trends to exhaust and yesterday, I gave my reasons why I believe we are at a turning point.
Why I believe gold has reached the top
Since writing that, I have had additional important confirmation.
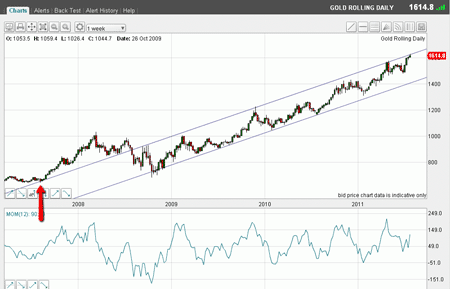
But first, I want to show on the long-term weekly chart the important 2007 low which anchored my upper tramline (it was chopped off in yesterday's version):

(Click on the chart for a larger version)
I have marked that point with a red arrow.
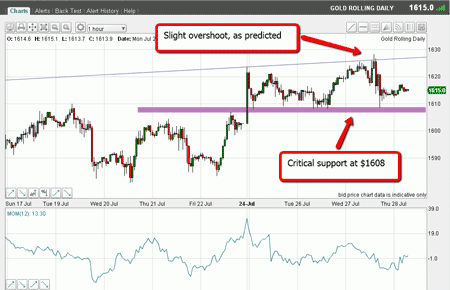
Now, let's look at yesterday's developments in greater detail. Here is the hourly chart:

(Click on the chart for a larger version)
After writing yesterday's email, the market did poke slightly above the four-year-old tramline, as I had suggested.
Then it turned tail with a vengeance, dropping $20 in a couple of hours.
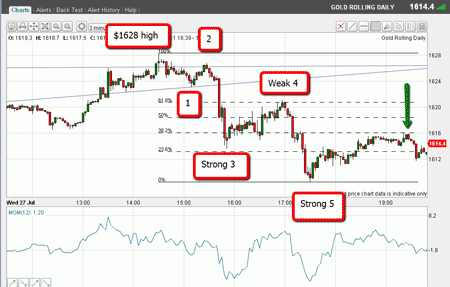
Now, let's look at the form of the decline to yesterday's $1,608 low. Here is the three-minute chart to show the fine detail:

(Click on the chart for a larger version)
Significantly, I can see a clear five-wave Elliott wave pattern which obeys all the correct guidelines.
This small-scale complete Elliott wave pattern confirms we have a new trend on our hands.
From the $1,608 low, I believe that we can now expect a corrective bounce in an A-B-C format.
In the chart, you will also see that I have overlaid the Fibonacci retracements on the entire decline. Observe how the relief rally has carried right to the Fibonacci 38.2% retracement (as marked by the green arrow) in a clear A-B-C pattern.
This is, once again, wonderful textbook stuff.
Watch the waves the tide has turned
With this basic understanding of Elliott waves, I know where we are in the market wave structure. And this is invaluable information.
Of course, the relief rally could carry somewhat higher in a larger A-B-C, but I can say with a high degree of confidence that the tide has turned, the top at $1,628 is on, and I will be looking for additional opportunities to short gold.
The other point I want to make is that if I am correct, we should be seeing new lows pretty soon.
A break of the $1,608 area should vitally confirm that.
In that case, we would be carving out a new larger Elliott wave pattern in five waves down.
Then, my wave5 would be a new larger wave 1, the overnight rally to $1,617 would be wave 2, and when wave3 ends, it would lie way below $1,608 perhaps in the $1,580 region or lower.
As ever, there is an alternate Elliott wave scenario which calls for new highs, and I may cover that in the future.
But meanwhile, the short-term trend appears to be down, and my four-year-old tramline has held the line once again!
Tomorrow, I will cover the recent exciting moves in the Dow.
Don't miss my next trading insight. To receive all my spread betting blog posts by email, as soon as I've written them, just sign up here .
Get the latest financial news, insights and expert analysis from our award-winning MoneyWeek team, to help you understand what really matters when it comes to your finances.
John is is a British-born lapsed PhD physicist, who previously worked for Nasa on the Mars exploration team. He is a former commodity trading advisor with the US Commodities Futures Trading Commission, and worked in a boutique futures house in California in the 1980s.
He was a partner in one of the first futures newsletter advisory services, based in Washington DC, specialising in pork bellies and currencies. John is primarily a chart-reading trader, having cut his trading teeth in the days before PCs.
As well as his work in the financial world, he has launched, run and sold several 'real' businesses producing 'real' products.
-
 The ‘mirror will’ flaw which could mean your savings end up with strangers – how to protect your legacy
Writing a will lets you pass your wealth onto your loved ones. But couples with a so-called ‘mirror will’ could unintentionally leave their family exposed to being cut out.
-
 Saba comes for Edinburgh Worldwide’s board... again
Saba Capital Management has announced fresh plans to displace the board of Edinburgh Worldwide despite having been decisively beaten in a recent vote