The return of gold
Gold has been very good to bullish investors and traders for many years. But now the market is at an interesting juncture, says John C Burford. Here, he looks at where it might go next.
Get the latest financial news, insights and expert analysis from our award-winning MoneyWeek team, to help you understand what really matters when it comes to your finances.
You are now subscribed
Your newsletter sign-up was successful
Want to add more newsletters?

Twice daily
MoneyWeek
Get the latest financial news, insights and expert analysis from our award-winning MoneyWeek team, to help you understand what really matters when it comes to your finances.

Four times a week
Look After My Bills
Sign up to our free money-saving newsletter, filled with the latest news and expert advice to help you find the best tips and deals for managing your bills. Start saving today!
Gold has arrived at an interesting juncture.
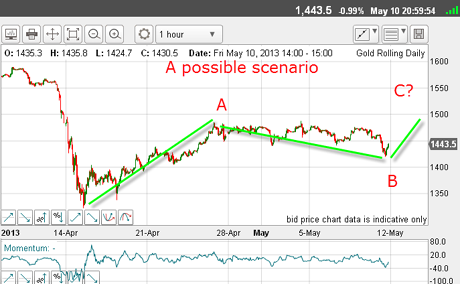
When I last covered it on 13 MayI wondered if it was ready for a rally, after the rapid plunge down to the $1,320 level in mid-April. Naturally, that shook the confidence of many bulls.
The fall attracted an awful lot of new shorts, as revealed by the COT data, and sentiment became extremely bearish as you would expect after such a large drop.
MoneyWeek
Subscribe to MoneyWeek today and get your first six magazine issues absolutely FREE

Sign up to Money Morning
Don't miss the latest investment and personal finances news, market analysis, plus money-saving tips with our free twice-daily newsletter
Don't miss the latest investment and personal finances news, market analysis, plus money-saving tips with our free twice-daily newsletter
But the magnitude of the bearish sentiment took my breath away, considering just a few weeks ago the market was full of gold bulls. How fickle are traders these days!
It's as if you are madly in love with someone one day, and because your beloved disappoints you in some way, you utterly reject them the next, forgetting how good it was for so long.
Yes, gold has been very good to many investors and traders for many years as it climbed its great bull market. But now, it is utterly rejected by those same bulls.
Waiting for the C wave

(Click on the chart for a larger version)
My best guess for the potential rally was this A-B-C formation.

(Click on the chart for a larger version)
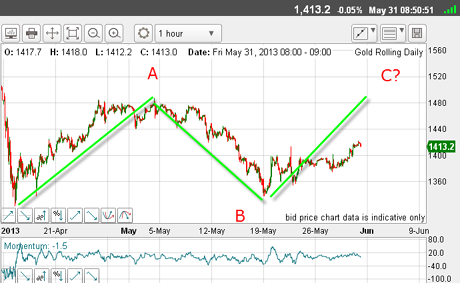
This is the hourly chart as of this morning, and although my original B wave low was too early, I do have a valid B wave and a potential C wave in the making. To confirm this as a C wave, I would need to see a rally above the A wave high in the $1,480 area.
Later today the most recent COT data will be released, but here is last week's data:
| Contracts of 100 Troy ounces | Row 0 - Cell 1 | Row 0 - Cell 2 | Row 0 - Cell 3 | Open interest: 446,087 | ||||
| Commitments | ||||||||
| 189,401 | 109,142 | 22,414 | 192,147 | 276,269 | 403,962 | 407,825 | 42,125 | 38,262 |
| Changes from 14/5/13 (Change in open interest: 2,281) | ||||||||
| 2,840 | 5,947 | -3,299 | 610 | 1,621 | 826 | 4,269 | 1,455 | -1,988 |
| Percent of open in terest for each category of traders | ||||||||
| 42.5 | 24.5 | 5.0 | 43.1 | 61.9 | 90.6 | 91.4 | 9.4 | 8.6 |
| Number of traders in each category (Total traders: 327) | ||||||||
| 129 | 111 | 70 | 62 | 64 | 222 | 218 | Row 8 - Cell 7 | Row 8 - Cell 8 |
So now, the hedge funds are only 1.7:1 long. This is a massive reduction, as only recently, they were well over 3:1 long. And the small specs are even-Stephen. This, too, is noteworthy.
The latest COT report comes out later today and could reveal an even more balanced breakdown.
So what are the chances the rally will extend?

(Click on the chart for a larger version)
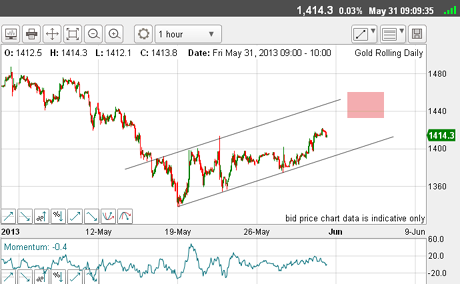
The rally has been very choppy, as I expected, as the market has had a severe shock to the system and the few bulls see a buying opportunity, while many other bulls are nursing big losses and wish to escape with some dignity (and capital) intact and are exiting on rallies.
I have a very pretty tramline pair. And the market is travelling inside the channel. I have a prior pivot point (PPP) on the upper line and five touch points on the lower line. In gold, which is a choppy market, this is about as good as it gets for tramline analysis.
A break of the lower line would be a bearish sign, and would probably indicate that I would need to abandon my $1,500 target. But if the market continues upwards, my next target is at the upper tramline in the $1,440 area (pink zone).
Under this scenario, because there is overhead resistance from trading in the first half of May, I expect step-wise racheting progress in a two up and one down manner.
Under recent relationships between various markets, if stocks are about to tumble (see recent posts), then gold should benefit.
If you're a new reader, or need a reminder about some of the methods I refer to in my trades, then do have a look at my introductory videos:
The essentials of tramline trading Advanced tramline trading An introduction to Elliott wave theory Advanced trading with Elliott waves Trading with Fibonacci levels Trading with 'momentum' Putting it all together
Don't miss my next trading insight. To receive all my spread betting blog posts by email, as soon as I've written them, just sign up here . If you have any queries regarding MoneyWeek Trader, please contact us here.
Get the latest financial news, insights and expert analysis from our award-winning MoneyWeek team, to help you understand what really matters when it comes to your finances.
John is is a British-born lapsed PhD physicist, who previously worked for Nasa on the Mars exploration team. He is a former commodity trading advisor with the US Commodities Futures Trading Commission, and worked in a boutique futures house in California in the 1980s.
He was a partner in one of the first futures newsletter advisory services, based in Washington DC, specialising in pork bellies and currencies. John is primarily a chart-reading trader, having cut his trading teeth in the days before PCs.
As well as his work in the financial world, he has launched, run and sold several 'real' businesses producing 'real' products.
-
 MoneyWeek Talks: The funds to choose in 2026
Podcast Fidelity's Tom Stevenson reveals his top three funds for 2026 for your ISA or self-invested personal pension
-
 Three companies with deep economic moats to buy now
Opinion An economic moat can underpin a company's future returns. Here, Imran Sattar, portfolio manager at Edinburgh Investment Trust, selects three stocks to buy now