The euro rallies – but what now?
The euro has rebounded from recent lows against the dollar. But now it stands at yet another crossroads. Which way will it turn next? John C Burford looks at what the charts can tell us.
Get the latest financial news, insights and expert analysis from our award-winning MoneyWeek team, to help you understand what really matters when it comes to your finances.
You are now subscribed
Your newsletter sign-up was successful
Want to add more newsletters?

Twice daily
MoneyWeek
Get the latest financial news, insights and expert analysis from our award-winning MoneyWeek team, to help you understand what really matters when it comes to your finances.

Four times a week
Look After My Bills
Sign up to our free money-saving newsletter, filled with the latest news and expert advice to help you find the best tips and deals for managing your bills. Start saving today!
When I left the euro on Monday, it was right at a crossroads and resting on my long-range tramline.
I believed that the action early this week would resolve the question will support collapse, or will it hold?
As I write early Wednesday morning, market action has confirmed in no uncertain way (with a rally of about 300 pips), that the support has held (so far).
MoneyWeek
Subscribe to MoneyWeek today and get your first six magazine issues absolutely FREE

Sign up to Money Morning
Don't miss the latest investment and personal finances news, market analysis, plus money-saving tips with our free twice-daily newsletter
Don't miss the latest investment and personal finances news, market analysis, plus money-saving tips with our free twice-daily newsletter
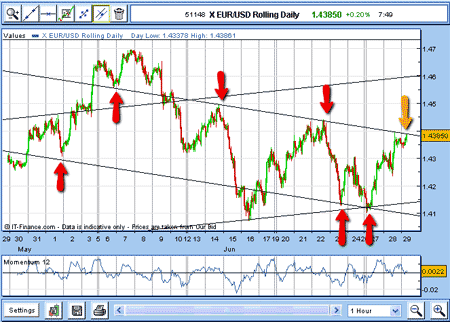
Here is the latest chart of the euro against the US dollar:

The lower tramline is the long-range line shown in my previous email. But now I can draw a new down-sloping pair, connecting the recent important highs and lows (marked by red arrows).
What tramlines can tell you
There are several points to note here.
First, early on Monday, the euro dropped to meet my long-term tramline where my new up-sloping tramline was also set.
When two tramlines from different angles meet, that is usually a point where there is significant support, or the market will move sharply through.
If you think of the market sitting on a stretched rubber band, the band will either propel the market back where it came from, or it will break! There really is no way of knowing which is to be the outcome beforehand. All we can do is observe market action surrounding that point.
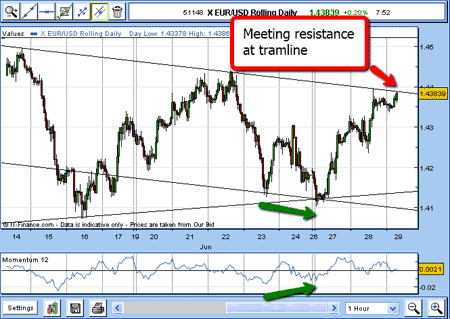
As of this morning, the market is challenging the upper tramline. Let's zoom in:

Pay attention to momentum
The second point to note is the behaviour of the momentum indicator on Friday and Monday.
As the new low was made on Monday, the momentum indicator was not following, and there was a potential positive divergence. This is marked by green arrows.
This means that selling pressure was weakening into Monday's low, and therefore, odds favoured the view that the support would hold.
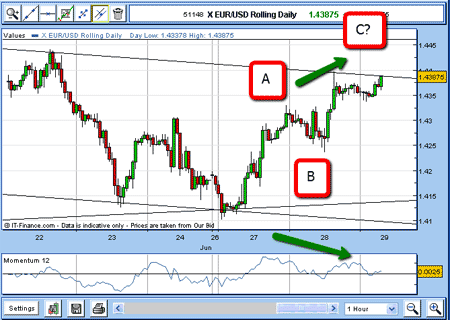
Here is an even closer look:

Alright, we are having our rally off the long-range tramline, but will it blast through my upper tramline? After all, this line of resistance has held previously.
Note also the pattern of the two-day rally. It is a clear three-wave A-B-C form. In a bear market, the C wave is usually the top of the rally.
Also note the potential negative momentum divergence marked by green arrows. This is usually a bearish signal.
Mr Market is a sneaky fellow
But markets are sneaky.
My A-B-C pattern may be the first in a larger corrective rebound.
I have seen many examples where my initial C wave was actually a larger scale A wave, and the market went on to make a B wave down, and then a huge rally to a higher C wave.
If this happens here, my upper target will be my upper up-sloping tramline (see top chart) in the 1.46 area.
The key to this scenario is the 22 June high at 1.440. If the market can climb up there, the odds will tilt towards the above view.
Once again, the euro is at a crossroads!
NB: Don't miss my next trading insight. To receive all my spread betting blog posts by email, as soon as I've written them, just sign up here .
Get the latest financial news, insights and expert analysis from our award-winning MoneyWeek team, to help you understand what really matters when it comes to your finances.
John is is a British-born lapsed PhD physicist, who previously worked for Nasa on the Mars exploration team. He is a former commodity trading advisor with the US Commodities Futures Trading Commission, and worked in a boutique futures house in California in the 1980s.
He was a partner in one of the first futures newsletter advisory services, based in Washington DC, specialising in pork bellies and currencies. John is primarily a chart-reading trader, having cut his trading teeth in the days before PCs.
As well as his work in the financial world, he has launched, run and sold several 'real' businesses producing 'real' products.
-
 Average UK house price reaches £300,000 for first time, Halifax says
While the average house price has topped £300k, regional disparities still remain, Halifax finds.
-
 Barings Emerging Europe trust bounces back from Russia woes
Barings Emerging Europe trust has added the Middle East and Africa to its mandate, delivering a strong recovery, says Max King