You are now subscribed
Your newsletter sign-up was successful
Want to add more newsletters?

Twice daily
MoneyWeek
Get the latest financial news, insights and expert analysis from our award-winning MoneyWeek team, to help you understand what really matters when it comes to your finances.

Four times a week
Look After My Bills
Sign up to our free money-saving newsletter, filled with the latest news and expert advice to help you find the best tips and deals for managing your bills. Start saving today!
TABLE.ben-table TABLE {BORDER-BOTTOM: #2b1083 1px solid; BORDER-LEFT: #2b1083 1px solid; BORDER-TOP: #2b1083 1px solid; BORDER-RIGHT: #2b1083 1px solid}TH {TEXT-ALIGN: center; BORDER-LEFT: #a6a6c9 1px solid; PADDING-BOTTOM: 2px; PADDING-LEFT: 1px; PADDING-RIGHT: 1px; BACKGROUND: #2b1083; COLOR: white; FONT-SIZE: 0.8em; FONT-WEIGHT: bold; PADDING-TOP: 2px}TH.first {TEXT-ALIGN: left; BORDER-LEFT: 0px; PADDING-BOTTOM: 2px; PADDING-LEFT: 1px; PADDING-RIGHT: 1px; FONT-SIZE: 0.8em; PADDING-TOP: 2px}TR {BACKGROUND: #fff}TR.alt {BACKGROUND: #f6f5f9}TD {TEXT-ALIGN: center; BORDER-LEFT: #a6a6c9 1px solid; PADDING-BOTTOM: 2px; PADDING-LEFT: 1px; PADDING-RIGHT: 1px; COLOR: #000; FONT-SIZE: 0.8em; PADDING-TOP: 2px}TD.alt {BACKGROUND-COLOR: #f6f5f9}TD.bold {FONT-WEIGHT: bold}TD.first {TEXT-ALIGN: left}TD.left {TEXT-ALIGN: left}TD.bleft {TEXT-ALIGN: left; FONT-WEIGHT: bold}
I will cover the euro today as it is at a crossroads. Last Wednesday, I posed the question: will the euro bounce?
MoneyWeek
Subscribe to MoneyWeek today and get your first six magazine issues absolutely FREE

Sign up to Money Morning
Don't miss the latest investment and personal finances news, market analysis, plus money-saving tips with our free twice-daily newsletter
Don't miss the latest investment and personal finances news, market analysis, plus money-saving tips with our free twice-daily newsletter
But it had broken down though a long-term trendline so the trend was down. Trading against an established trend is always riskier.
Many successful traders always trade with the prevailing trend.
But, as a contrarian-leaning trader, I do know that trends do not go on forever! In fact, I actively search for these turns in my swing trading.
The process is this. As a trend gets going, more and more traders take positions with this trend until they reach a concentration where there are just too many bodies to one side of the ship, and not enough on the other and the ship is then in danger of capsizing, drowning the majority!
This is really a manifestation of human nature. As the trend becomes established, more and more fence-sitters join the crowd safety in numbers! as the market proves their earlier forecasts correct.
Over the months, I have pointed out several examples where this has occurred.
And when the turn comes, it can lead to a huge counter-trend move, providing a nimble swing trader with a quick in-and-out profit usually before the mainstream media realise what has happened.
When assessing market sentiment, I use what I call the headline indicator'.
When a market development appears in a major headline in the papers, that is the time to look for a turn.
OK, back to the euro.
Last time, I showed my less-than-impressive tramline trio on the hourly chart:
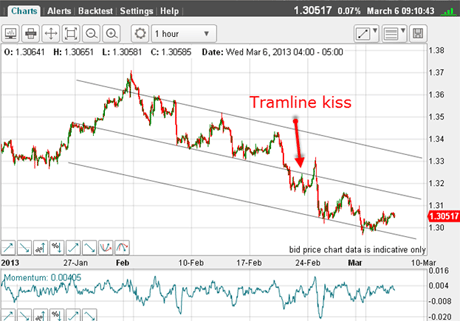
(Click on the above chart for a larger version)
There was support off the lowest tramline, but to me the small rally smacked of weakness and appeared laboured.
Here is this morning's chart:
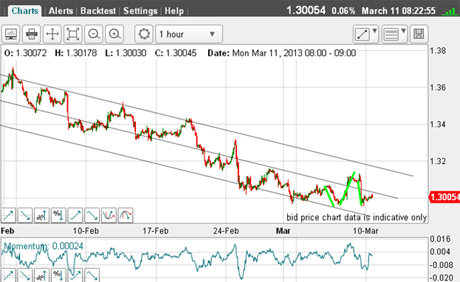
(Click on the above chart for a larger version)
Since Wednesday, the market has dipped, rallied to 1.31, and then dipped back under the 1.30 level (green bars).
So, not much direction there.
Also, recall that last week, I was unsure how much longer my tramlines would remain useful. This latest action has caused me to become more skeptical still. After all, it rallied into the channel between the top and middle tramlines and then turned back.
But if we are to see a rally, as I have mooted, what does the sentiment picture look like?
For many months, sentiment had been extremely bullish, as expectations grew that the eurozone problems were over and sunny uplands lie just ahead.
Since the 1.37 high and then the subsequent rapid decline, I wonder what has happened to sentiment?
One measure is the Commitments of Traders (COT) data and these are the latest figures from 5 March:
| OPEN INTEREST: 218,469 | ||||||||
| COMMITMENTS | ||||||||
| 63,355 | 89,471 | 6,755 | 107,811 | 69,195 | 177,921 | 165,421 | 40,548 | 53,048 |
| CHANGES FROM 09/11/12 (CHANGE IN OPEN INTEREST: -12,098) | ||||||||
| -11,477 | 5,245 | 952 | 6,500 | -24,085 | -4,025 | -17,888 | -8,073 | 5,790 |
| PERCENT OF OPEN INTEREST FOR EACH CATEGORY OF TRADERS | ||||||||
| 29.0 | 41.0 | 3.1 | 49.3 | 31.7 | 81.4 | 75.7 | 18.6 | 24.3 |
| NUMBER OF TRADERS IN EACH CATEGORY (TOTAL TRADERS: 173) | ||||||||
| 31 | 67 | 19 | 51 | 46 | 94 | 120 | Row 8 - Cell 7 | Row 8 - Cell 8 |
While the specs remain short, it is the changes in the week that are more illuminating.
Both the non-commercials (mainly hedgies) and the small specs have dumped their long positions and increased their shorts.
In fact, the net swing of the hedgies to the short side is a massive 12% in the week.
That is a very large swing in sentiment and sets up the possibility of that rally.
But did last week's rally to the 1.31 area perform this task of relieving this imbalance?
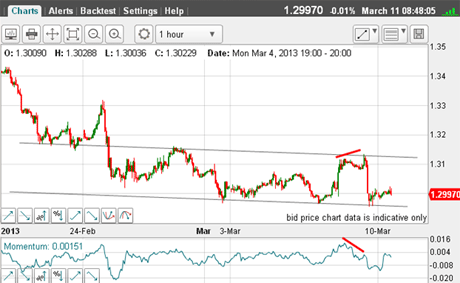
Here is the 15-minute chart:
(Click on the above chart for a larger version)
I have a good tramline pair drawn and note the rally was an A-B-C affair with a big negative-momentum divergence at the high (red bars). This is bearish behaviour, of course.
On Friday, the market made a sharp break back down to my lower tramline and is currently struggling to get up off the floor.
As I see it this morning, there appears to be little gas in the tank for another rally back above the 1.31 area and the path of least resistance still appears to be down.
Any trader with a bearish bias would be looking at shorting the market with a very natural place for a protective stop.
A break below the lower tramline should herald even lower prices unless we see another nasty head fake, of course!
As I have noted many times, because the financial markets are being ultimately driven by changes in liquidity (basically, money supply and credit), stocks and the euro and many other markets have been more-or-less in sync for several years.
But recently, while stocks have been in strong rally mode, the euro has been declining, thus breaking the relationship and setting up a massive divergence.
The US dollar has been rallying against most predictions while stocks have been in the same mode. This is unusual.
If you compare with the Japanese Nikkei, it has been in strong rally mode while the yen has been collapsing since late last year. The weakening yen has given the stock bulls a logical reason to buy, especially when they see other world stock markets showing strength.
But why is the US dollar advancing with stocks?
Obviously, the dynamics in the Japanese market are not the same as in the US.
If you're a new reader, or need a reminder about some of the methods I refer to in my trades, then do have a look at my introductory videos:
The essentials of tramline trading
An introduction to Elliott wave theory
Advanced trading with Elliott waves
Don't miss my next trading insight. To receive all my spread betting blog posts by email, as soon as I've written them, just sign up here . If you have any queries regarding MoneyWeek Trader, please contact us here.
-
 ISA fund and trust picks for every type of investor – which could work for you?
Whether you’re an ISA investor seeking reliable returns, looking to add a bit more risk to your portfolio or are new to investing, MoneyWeek asked the experts for funds and investment trusts you could consider in 2026
-
 The most popular fund sectors of 2025 as investor outflows continue
It was another difficult year for fund inflows but there are signs that investors are returning to the financial markets

