The euro has moved as predicted – time to bank profits
When the odds are no longer firmly in your favour, it makes little sense to chase a trade to the bitter end, says John C Burford.
Get the latest financial news, insights and expert analysis from our award-winning MoneyWeek team, to help you understand what really matters when it comes to your finances.
You are now subscribed
Your newsletter sign-up was successful
Want to add more newsletters?

Twice daily
MoneyWeek
Get the latest financial news, insights and expert analysis from our award-winning MoneyWeek team, to help you understand what really matters when it comes to your finances.

Four times a week
Look After My Bills
Sign up to our free money-saving newsletter, filled with the latest news and expert advice to help you find the best tips and deals for managing your bills. Start saving today!
They say a week is a long time in politics. But in swing trading, a day can seem just as long! Since my sudden bullish-to-bearish change of heart towards the euro, as discussed in my postof 20 May ("I called two big movements in the euro but we're out of easy trades for now"), the euro has moved lower. It's now in accordance with my road map.
Last week, I laid out my case for a weakening euro. My reasoning had nothing whatsoever to do with eurozone politics it was based partly on the trader sentiment picture.
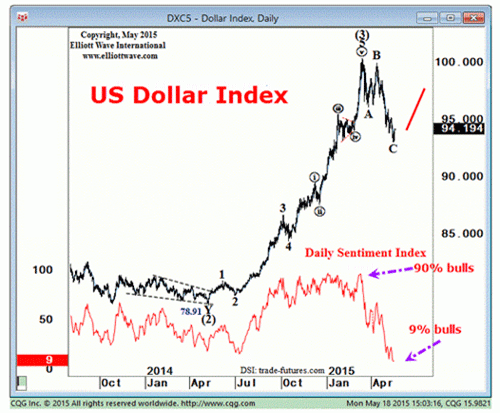
I showed you the chart below, which demonstrates that sentiment plunged from 90% dollar bulls (euro bears) as the dollar index reached the milestone 100 region to the lowly 9% bulls with the sharp decline to the C wave low. That was a massive sentiment shift in a short space of time.
MoneyWeek
Subscribe to MoneyWeek today and get your first six magazine issues absolutely FREE

Sign up to Money Morning
Don't miss the latest investment and personal finances news, market analysis, plus money-saving tips with our free twice-daily newsletter
Don't miss the latest investment and personal finances news, market analysis, plus money-saving tips with our free twice-daily newsletter

Chart courtesy www.elliottwave.com
So what is it that makes trader sentiment change? Do we react to the news, or is there something internal going on in the human race that is independent of outside events? In the same way, it's worth considering what makes a fad come and go. Once upon a time, hula hoops were all the rage, but they died just as suddenly as they arose. Once, every child had one. But have you seen one on the streets lately?
Here's how I knew that the euro would start down
But that was not the only clue that the euro would soon start down. This is the latest commitments of traders (COT) data:
| (Contracts of EUR 125,000) | Row 0 - Cell 1 | Row 0 - Cell 2 | Row 0 - Cell 3 | Open interest: 428,580 | ||||
| Commitments | ||||||||
| 38,758 | 207,097 | 9,551 | 338,273 | 129,839 | 386,582 | 346,487 | 41,998 | 82,093 |
| Changes from 05/12/15 (Change in open interest: -10,542) | ||||||||
| -4,575 | -15,212 | 1,165 | -6,828 | 1,906 | -10,238 | -12,141 | -304 | 1,599 |
| Percent of open in terest for each category of traders | ||||||||
| 9.0 | 48.3 | 2.2 | 78.9 | 30.3 | 90.2 | 80.8 | 9.8 | 19.2 |
| Number of traders in each category (Total traders: 240) | ||||||||
| 52 | 101 | 36 | 53 | 59 | 125 | 176 | Row 8 - Cell 7 | Row 8 - Cell 8 |
For the week ending 19 May, the hedge funds who are primarily trend-followers reduced their short positions into a rising market. That is a small sign of capitulation to the rising trend, which was about to turn.
The market moved to my fourth tramline right on cue
But I have a possible solution. When you see the market going your way after you have abandoned ship, get back in (with a sensible protective stop, of course). It is remarkable how often that act of exiting and re-entering the market acts as a tell.
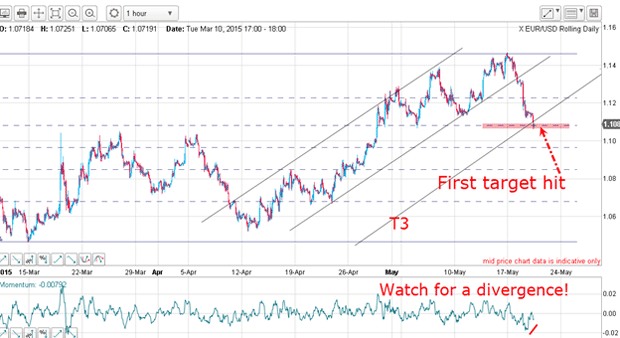
So let's review where we were on 20 May. My first downside target was hit that morning where the Fibonacci 38% level met T3. That was my first goal accomplished.

But was there likely to be more downside? After all, the swift decline was still trapping a lot of euro bulls where bullish sentiment remained extremely high.
So the odds for a direct move lower were high.
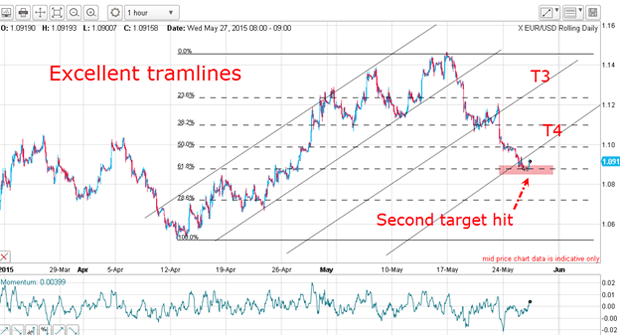
Now look at this morning's chart below. Right on cue the market declined to T4, my fourth tramline, which was also the Fibonacci 62% level. How very convenient! And what a terrific place to take some profits off the table.

Remember, I was short from around 1.1360 on 18 May and at the current 1.09 print, that is a tidy profit of 460 pips.
So, what is the outlook as I write?
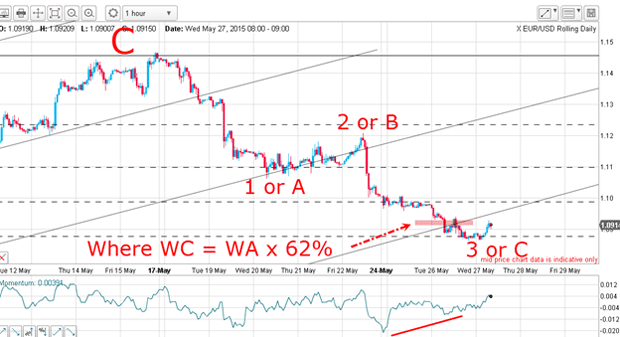
Below is a close-up of the move down off the big C wave high. The market has hit the area where wave C = wave A x Fib 62% which is a common Fibonacci relationship between the A and C waves of an A-B-C.

But is the move down an A-B-C or a 1-2-3 (ongoing)? If it is an A-B-C, then that implies the market will rally. If the market is in a third wave, that implies the opposite: the market will continue down. With no further information at hand, I am unable to select which outcome is the more likely. And that means I must take profits while I wait for the pattern to clear.
How to play the market when the odds aren't clear
Many traders lose money (or give up big gains) by believing in their position because it is in profit. And they are reluctant to give up this belief until forced into it by a market reversal.
OK, I may lose out on a little more downside if the market declines from here, but I have money safely in the bank and have assessed the situation calmly. I may be wrong, but so what? I have been wrong before and I shall be wrong again. It's all part of this fascinating game we play.
Get the latest financial news, insights and expert analysis from our award-winning MoneyWeek team, to help you understand what really matters when it comes to your finances.
John is is a British-born lapsed PhD physicist, who previously worked for Nasa on the Mars exploration team. He is a former commodity trading advisor with the US Commodities Futures Trading Commission, and worked in a boutique futures house in California in the 1980s.
He was a partner in one of the first futures newsletter advisory services, based in Washington DC, specialising in pork bellies and currencies. John is primarily a chart-reading trader, having cut his trading teeth in the days before PCs.
As well as his work in the financial world, he has launched, run and sold several 'real' businesses producing 'real' products.
-
 Average UK house price reaches £300,000 for first time, Halifax says
While the average house price has topped £300k, regional disparities still remain, Halifax finds.
-
 Barings Emerging Europe trust bounces back from Russia woes
Barings Emerging Europe trust has added the Middle East and Africa to its mandate, delivering a strong recovery, says Max King