The euro is following my script in the charts
Combining Elliott wave theory with tramlines can be a powerful market indicator. Here, John C Burford uses it to chart the euro.
Get the latest financial news, insights and expert analysis from our award-winning MoneyWeek team, to help you understand what really matters when it comes to your finances.
You are now subscribed
Your newsletter sign-up was successful
Want to add more newsletters?

Twice daily
MoneyWeek
Get the latest financial news, insights and expert analysis from our award-winning MoneyWeek team, to help you understand what really matters when it comes to your finances.

Four times a week
Look After My Bills
Sign up to our free money-saving newsletter, filled with the latest news and expert advice to help you find the best tips and deals for managing your bills. Start saving today!
I will follow up on the euro today because it's highlighting an important benefit of my trading methods: the Elliott wave model combined with my tramline technique can give you a powerful edge if you know how to use it!
Incidentally, you can have the very best trading method in the world, and still lose money, while another trader using the identical method may succeed (or vice versa, of course). This is simply because of the human factor.
We all bring our own biases, strengths and weaknesses into the trading arena. Some are more disciplined than others, and some come to trading with a faulty idea of what it takes to make it. But that is a subject for another day.
MoneyWeek
Subscribe to MoneyWeek today and get your first six magazine issues absolutely FREE

Sign up to Money Morning
Don't miss the latest investment and personal finances news, market analysis, plus money-saving tips with our free twice-daily newsletter
Don't miss the latest investment and personal finances news, market analysis, plus money-saving tips with our free twice-daily newsletter
For now, I'm going to get back to the euro.
Why traders need detective skills

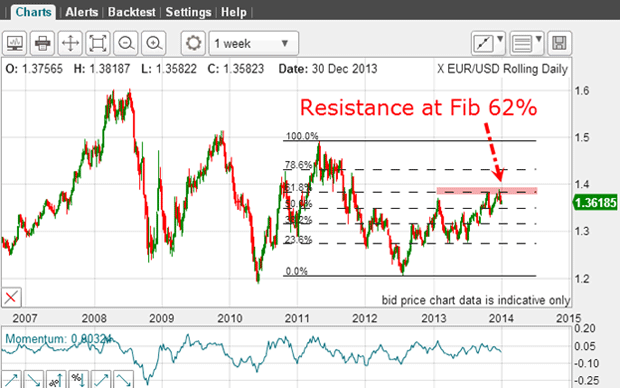
The blow-off top took the market to the Fibonacci 62% retrace of the latest large wave down off the most significant high to the major 2012 low. This was a level that was flagged well in advance. That means you could have prepared your trading stance with time to spare.
Also, the rally off the 2012 low is a clear A-B-C. That tells you that it is corrective to the main trend, which is down. That was another clue to position short.
You see, performing an analysis in this way is very much like a detective building a case from the evidence, which may come from many avenues. When all the evidence is in, it goes before the judge. In our case, the judge is Mr Market!
How to find the evidence
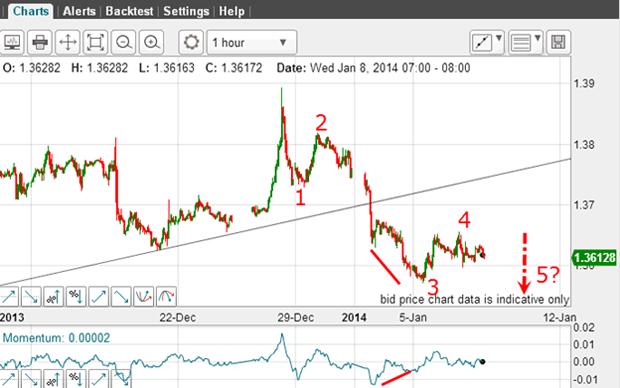
I showed my Elliott wave count

My wave 3 did terminate on Monday, as I forecast. Remember, third waves are almost always long and strong and can extend beyond where you think it should end.
One clue that wave 3 is about to end is in the momentum reading. When momentum is edging up in a potential positive divergence, it is indicating a weakening of the selling pressure. There is a very large positive-momentum divergence at my wave 3 low.
Yesterday, the market followed the script and edged up in wave 4. But are there any clues as to how high wave 4 would extend? This is time to take a closer look.
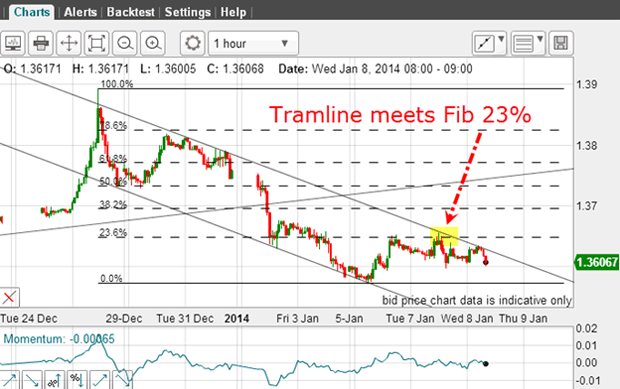
Now that I have a few small waves down off the top, I can look for tramlines:

Here they are and they were not difficult to find. My lower line is drawn across the three sets of minor lows. And the upper line joins the wave 2 highs, with the market currently bouncing down off this line as it hit resistance.
I have also drawn in the Fibonacci levels off the top and the wave 4 rally carried to the meeting of the tramline and the Fibonacci 23% level.
Remember, when you have a good tramline meeting a solid Fibonacci retrace level, that represents extra-strong resistance. And because I expect a move down to new lows in my forecast wave 5, the odds are high that wave 4 has completed.
The euro could be in for an eventful year
From the macro perspective, pressure is building in the eurozone for the European Central Bank to do something to counter the deflationary wave sweeping across Europe. So it seems 2014 will be a very eventful year for the euro.

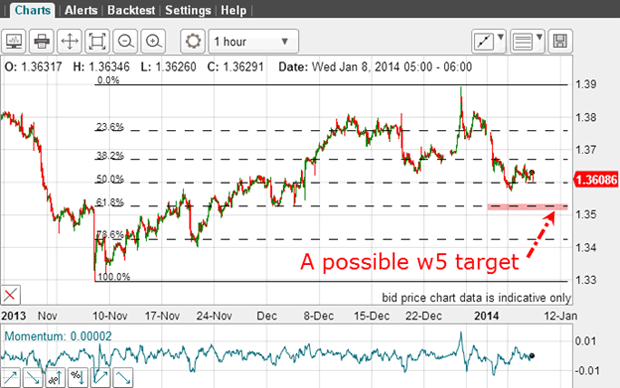
Here is the rally off the major November low with the Fibonacci levels. The market is currently testing the Fibonacci 50% level. And if my analysis is correct, this level should give way. The next target for wave 5 is the 62% level just above 1.35.
The alternative view is that the move down off the top is in an A-B-C form (only three waves so far). This implies a bounce up to new highs. But to me, this is a lower probability because it would have to push up through the strong resistance offered by the tramline in my second chart.
If my Elliott wave forecast is correct, that would magnify the odds that the trend was down and lower values lie ahead.
Get the latest financial news, insights and expert analysis from our award-winning MoneyWeek team, to help you understand what really matters when it comes to your finances.
John is is a British-born lapsed PhD physicist, who previously worked for Nasa on the Mars exploration team. He is a former commodity trading advisor with the US Commodities Futures Trading Commission, and worked in a boutique futures house in California in the 1980s.
He was a partner in one of the first futures newsletter advisory services, based in Washington DC, specialising in pork bellies and currencies. John is primarily a chart-reading trader, having cut his trading teeth in the days before PCs.
As well as his work in the financial world, he has launched, run and sold several 'real' businesses producing 'real' products.
-
 ISA fund and trust picks for every type of investor – which could work for you?
Whether you’re an ISA investor seeking reliable returns, looking to add a bit more risk to your portfolio or are new to investing, MoneyWeek asked the experts for funds and investment trusts you could consider in 2026
-
 The most popular fund sectors of 2025 as investor outflows continue
It was another difficult year for fund inflows but there are signs that investors are returning to the financial markets