The US passes the QE baton to Japan
Stockmarkets loved Japan's revitalised money-printing programme. But, asks John C Burford, how much more upside can there be?
Get the latest financial news, insights and expert analysis from our award-winning MoneyWeek team, to help you understand what really matters when it comes to your finances.
You are now subscribed
Your newsletter sign-up was successful
Want to add more newsletters?

Twice daily
MoneyWeek
Get the latest financial news, insights and expert analysis from our award-winning MoneyWeek team, to help you understand what really matters when it comes to your finances.

Four times a week
Look After My Bills
Sign up to our free money-saving newsletter, filled with the latest news and expert advice to help you find the best tips and deals for managing your bills. Start saving today!
In a last-ditch desperate move by central banks to keep all of the plates in the air, Japan made a shock pledge to resume QE (quantitative easing) operations. Its previous QE operations were such a roaring success in stimulating the economy (current GDP is declining at annual rate of 7% with benchmark interest rates stuck on zero) that it has loaded Big Bertha (aka Abe's first arrow) for another round of money printing.
The well-known definition of insanity comes to mind here.
At the same time, as expected, the US Fed wound down its money-printing operations to zero. Was that an accident of timing?
MoneyWeek
Subscribe to MoneyWeek today and get your first six magazine issues absolutely FREE

Sign up to Money Morning
Don't miss the latest investment and personal finances news, market analysis, plus money-saving tips with our free twice-daily newsletter
Don't miss the latest investment and personal finances news, market analysis, plus money-saving tips with our free twice-daily newsletter
This is not the place for me to go into highlighting the even taller and ultimately unstable and dangerous house of (debt) cards that central banks are foisting on us. But one thing is certain: the stockmarkets loved it at least for a day.
The Fed's scramble to keep global asset bubbles alive
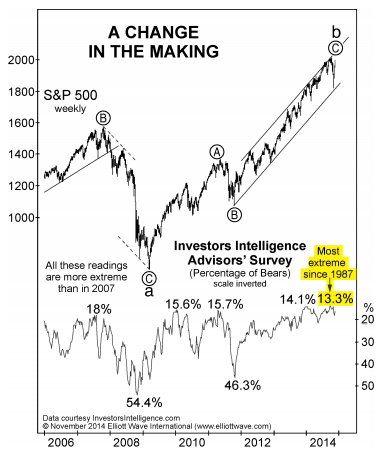
The buy-the-dippers had a field day after the Bank of Japan announcement, cheered on by the overwhelmingly bullish money managers/advisors. Here is an illuminating chart:

Chart courtesy elliottwave.com
There are currently only a record low 13% of professional advisors who are bearish on stocks. The US media was full of advice to buy the dip last month and boy, did they! And the surprise Japanese rocket on Friday only served to amplify their bullishness.
Remember, stockmarket tops are always made on extreme bullish sentiment.
It is clear to me that the mid-October Dow swoon of 1,500 points within just a few days put a massive scare into the Fed. It was staring down the barrel of a dreaded deflationary depression and had to do something. It was looking as if the markets were in freefall. Because it had pledged not to amend its taper programme (as some were hoping for), it phoned around to see what central bank was willing to take the QE baton in order to keep the global asset bubbles alive. Japan was the obvious choice.
The eurozone was a no-go because of Germany's solid opposition to QE; the UK had already done its bit; so Japan, in the form of Abenomics on steroids, came to the Fed's rescue just in time. Is it possible that insiders front-ran Friday's announcement by turning shares back up from the abyss two weeks ago? Hmm.
In any case, Friday's rocket shot my immediately bearish stance out, with the Dow making a new all-time high, the Nasdaq at a multi-year high, and the S&P matching the 19 September top. The small cap Russell 2000 fell short of new highs.
The German DAX and UK FTSE both lagged a very telling divergence.
What the charts are telling us
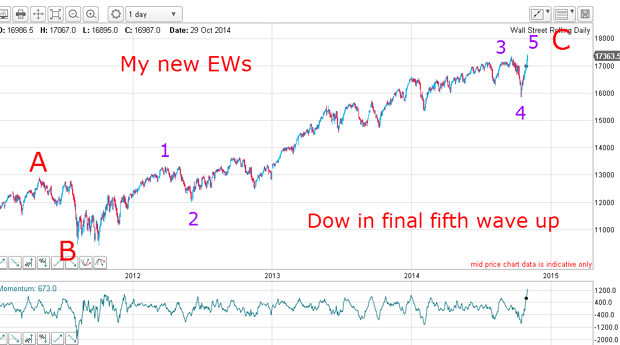
So, with all that drama, are the charts telling me anything useful? Here is a long-term daily chart which shows my revised Elliot wavelabels:

I still have my large C wave, but now I have a well-proportioned five motive waves with the third wave very long and strong. This wave contains many sub-five wave patterns.
Why not have fun and see how many five-wave patterns at different degrees of scale you can find in wave 3?
The 19 September top is now my wave 3 (not wave 5, as I originally believed), the 1,500 point plunge is my new wave 4 and we are now in the final wave 5 up.
Note that waves 2 and 4 are both A-B-Cs and of about equal height. The guideline that waves should look right' and in proportion is being obeyed, and the proportions look much better now than in my previous labelling.
As an Elliott wave technician, you must constantly review your labels in the light of new market action that comes your way. If the stockmarket does something unexpected, it pays to be prepared to move them.
Can I find better tramlines to go with my EWs?
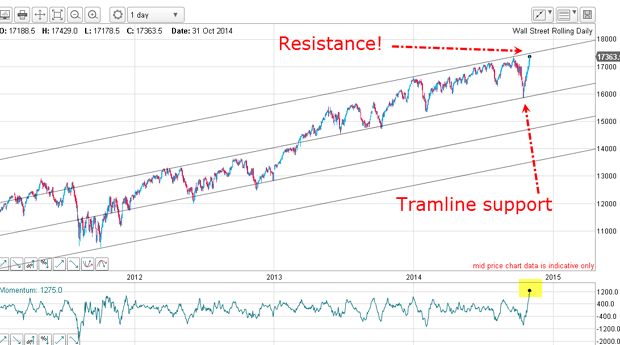
Now I have better EWs, do I have some great tramlinesto go with it?

Here is a very good tramline quartet with ample accurate touch points all round. I first drew the second tramline, taking in the October low. Then, I drew the highest tramline and was pleased to see three very accurate touch points at the highs. Then, when I drew the fourth tramline, I was very pleased to see that it passed accurately across the 2011 low. Nice.
The vigorous rally off the October low has produced a hugely overbought momentum reading and that sounds a note of caution to those bulls who expect more upside. Also, the market is getting very close to my upper tramline where there is stiff resistance. That would be an ideal place for the market to make a major turn as wave 5 terminates.
The subtle clue that stockmarkets now have limited upside
Friday's action was very emotional with the USD/JPY gaining over 200 points and the Nikkei up massively.
But strangely, US Treasuries hardly moved on the news. And that must be worrying for the bulls who expect the share rocket to go to the moon.
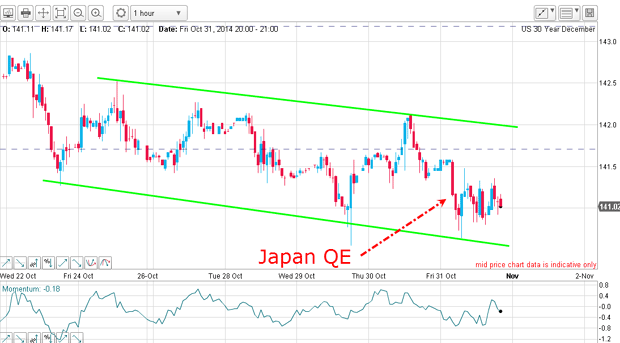
With risk off in that scramble to load up on equities, I would have expected T-Bond yields to rocket (prices to decline), but it was a pretty calm day on Friday:

The trend has been down since the blow-off spike top on 15 October, but there was no flight out of safe-haven bonds. This could be a subtle clue that stocks now have limited upside, unless matched by weakness in the bonds.
Why I consider this campaign a success
To review my trades: I shorted the Dow at the 17,345 level on 19 September. I added to shorts at 17,215 on 25 September.
I covered half positions on 14 October at 16,350 for a gain of 1,860 points.
Then, I covered the remainder at 16,960 on 30 October for another gain of 640 points. Total profit was 2,500 points.
On the debit side, I had five aborted short trades, losing a total of 300 points for a net profit of 2,200 points.
I consider that an excellent campaign, despite the market ending on Friday higher than when I first shorted it on 19 September. The amazingly deep V-shaped October market was tricky, and it required nimble footwork to take profits.
Now I am ready to start a new Dow campaign when I see another high probability/low risk setup.
Get the latest financial news, insights and expert analysis from our award-winning MoneyWeek team, to help you understand what really matters when it comes to your finances.
John is is a British-born lapsed PhD physicist, who previously worked for Nasa on the Mars exploration team. He is a former commodity trading advisor with the US Commodities Futures Trading Commission, and worked in a boutique futures house in California in the 1980s.
He was a partner in one of the first futures newsletter advisory services, based in Washington DC, specialising in pork bellies and currencies. John is primarily a chart-reading trader, having cut his trading teeth in the days before PCs.
As well as his work in the financial world, he has launched, run and sold several 'real' businesses producing 'real' products.
-
 MoneyWeek Talks: The funds to choose in 2026
Podcast Fidelity's Tom Stevenson reveals his top three funds for 2026 for your ISA or self-invested personal pension
-
 Three companies with deep economic moats to buy now
Opinion An economic moat can underpin a company's future returns. Here, Imran Sattar, portfolio manager at Edinburgh Investment Trust, selects three stocks to buy now