Stalking a good trade takes patience - here's how I do it
When spread betting, a good trade rarely presents itself just when you happen to switch on your computer. It pays to be patient. Here's how to do it.
Get the latest financial news, insights and expert analysis from our award-winning MoneyWeek team, to help you understand what really matters when it comes to your finances.
You are now subscribed
Your newsletter sign-up was successful
Want to add more newsletters?

Twice daily
MoneyWeek
Get the latest financial news, insights and expert analysis from our award-winning MoneyWeek team, to help you understand what really matters when it comes to your finances.

Four times a week
Look After My Bills
Sign up to our free money-saving newsletter, filled with the latest news and expert advice to help you find the best tips and deals for managing your bills. Start saving today!
It pays to be patient when stalking a trade. Rarely does a good trade present itself just when you happen to switch on your computer! Mostly, you need to do basic research using the weekly, daily, and then hourly charts, doing your Elliott wave analysis and then applying the Fibonacci tool to the larger waves, if appropriate.
Then you need to keep watch over the internals of the market, such as momentum, bullish/bearish data, and so on. In my blogs, I show you how I do this. You may have a different set of input parameters that have proven to you that they work.
Luckily for traders today, much of this data is freely and easily available on the internet in fact, there is too much information out there. You need to be selective in the data you rely on for trading. I have developed my 'tramline trading' concept to simplify the process of trade selection and here is a great example of a tramline trade that took place over five days.
MoneyWeek
Subscribe to MoneyWeek today and get your first six magazine issues absolutely FREE

Sign up to Money Morning
Don't miss the latest investment and personal finances news, market analysis, plus money-saving tips with our free twice-daily newsletter
Don't miss the latest investment and personal finances news, market analysis, plus money-saving tips with our free twice-daily newsletter
My favourite market the euro / dollar
Since I follow closely only a handful of markets, and a few more peripheral ones, I can stalk a trade quite readily.
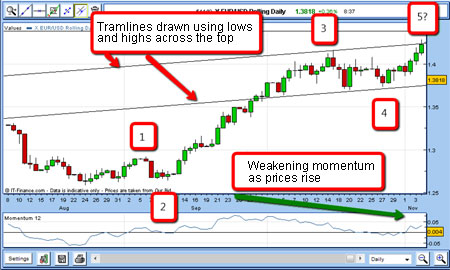
In September and into October, the EUR/USD was rallying as the US dollar was slammed by the prospect of more quantitative easing(money-printing) by the Fed.
This was a classic situation that called for one of my all-time favourite trading quotes:
"When it appears obvious, it is obviously wrong" Joe Granville, legendary trader.
What this means to me is that when the vast majority of the public believe in one outcome (which logically cannot be refuted), they are wrong, and the market usually turns sometimes violently.
Since I love to trade market turns, which catch the majority of traders out, this was an ideal set-up for me. And I could employ my tramline trading technique.
As the EUR made its way to the 1.40 area, where I expected massive resistance, I decided to see how the market would react. There was a brief pull-back on 20 October, a slight rally, then another pull-back on 27 October, and then the market began another rally (see chart below).

Now I had just enough points to draw my tramlines. I started with the lower one (which had several low touch points). The upper tramline was tentative, as I drew it parallel to the lower line, but only had one point at the high at 1.4160.
But that is OK we have to use incomplete information when trading all the time.
Note that we rarely see perfection here there has to be some latitude in drawing the lines, as often the points do not exactly touch your best fit tramline there is often some overlap or undershoot.
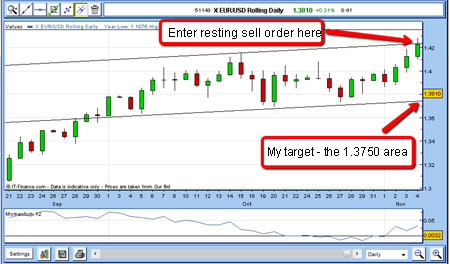
The market then rallied to a new high on 4 November in the 1.4275 area, where I was waiting to short.
I had placed a resting sell order at 1.4250, which was filled on 4 November. If that was indeed the top, then the negative divergence in momentum would remain and give confirmation of the top. Beforehand, I decided that I would place my protective stop only slightly above the upper tramline, since if I was wrong, a move above the tramline would prove it. Of course, I used my 3% rule to limit the loss, if I was wrong.
Here is a closer look at the daily chart:

4 Nov sell £1 rolling EUR/USD @ 1.4250.
Protective stop @ 1.4325.
Risk £75 (1.5%)
The very next day, 5 November, the market reacted violently to hitting my tramline and dropped hard. That is when I moved my protective stop down to break-even using my break-even rule, so now I had a free ride. This is always satisfying, as it frees up capital to look for other trades.
Over the next few days, the market continued its fall and as it approached my lower tramline on weakening momentum, I placed a resting order to cover my short if the market hit the line at 1.3750.
I was not concerned if the market decided to plunge through the tramline.
Of course, in that event, I would be leaving extra profit on the table.
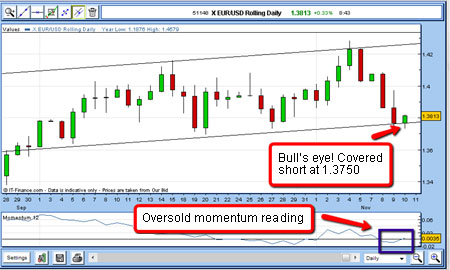
Those are the breaks. But my intention from the start of the trade was to take a short-term profit. It rarely pays to change your intentions in mid-stream always remember, successful trading means being disciplined. I was covered on 9 November , as the chart below shows.

9 Nov covered short EUR/USD @ 1.3750.
Profit £500.
Risk £75
This was a satisfactory five-day trade.
Now the euro had hit the lower tramline, would it bounce upwards again? And should I be going long? That's a story for another blog...
Get the latest financial news, insights and expert analysis from our award-winning MoneyWeek team, to help you understand what really matters when it comes to your finances.
John is is a British-born lapsed PhD physicist, who previously worked for Nasa on the Mars exploration team. He is a former commodity trading advisor with the US Commodities Futures Trading Commission, and worked in a boutique futures house in California in the 1980s.
He was a partner in one of the first futures newsletter advisory services, based in Washington DC, specialising in pork bellies and currencies. John is primarily a chart-reading trader, having cut his trading teeth in the days before PCs.
As well as his work in the financial world, he has launched, run and sold several 'real' businesses producing 'real' products.
-
 Can mining stocks deliver golden gains?
With gold and silver prices having outperformed the stock markets last year, mining stocks can be an effective, if volatile, means of gaining exposure
-
 8 ways the ‘sandwich generation’ can protect wealth
People squeezed between caring for ageing parents and adult children or younger grandchildren – known as the ‘sandwich generation’ – are at risk of neglecting their own financial planning. Here’s how to protect yourself and your loved ones’ wealth.