Two of the most useful tools in a spread better's kit
Elliot wave analysis and Fibonacci retracement are two of the most useful tools a spread better can use. John C Burford explains why.
Get the latest financial news, insights and expert analysis from our award-winning MoneyWeek team, to help you understand what really matters when it comes to your finances.
You are now subscribed
Your newsletter sign-up was successful
Want to add more newsletters?

Twice daily
MoneyWeek
Get the latest financial news, insights and expert analysis from our award-winning MoneyWeek team, to help you understand what really matters when it comes to your finances.

Four times a week
Look After My Bills
Sign up to our free money-saving newsletter, filled with the latest news and expert advice to help you find the best tips and deals for managing your bills. Start saving today!
In my last post, I described a possible trading scheme in the AUS/USD using Elliott wave and Fibonacci tools. I hope you found some great examples of Fibonacci retracements in your charts.
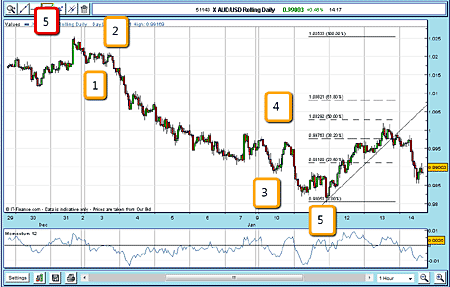
Let's get back to the AUS/USD and get our Fibonacci tool working again and apply it to the pivot points of wave 5 (the red box) and the 11 January low, which is wave A (consisting of the numbers in the yellow boxes). This is in itself a Fibonacci 61.8% retrace of the previous wave!

(Click on the chart for a larger version)
MoneyWeek
Subscribe to MoneyWeek today and get your first six magazine issues absolutely FREE

Sign up to Money Morning
Don't miss the latest investment and personal finances news, market analysis, plus money-saving tips with our free twice-daily newsletter
Don't miss the latest investment and personal finances news, market analysis, plus money-saving tips with our free twice-daily newsletter
The market rallied past the Fibonacci 38.2% level on 13 January. As a result I could draw a small uptrend line. If you were trading, you could have decided to set protect-profit stops just under this line. If so, you would have been stopped out on 13 January for a nice 150 pip gain.
But take a look at the form of the move down to the 11 January low it is in a clear five-wave pattern (the yellow boxes). We know what that means a three-wave counter-trend move lies ahead!
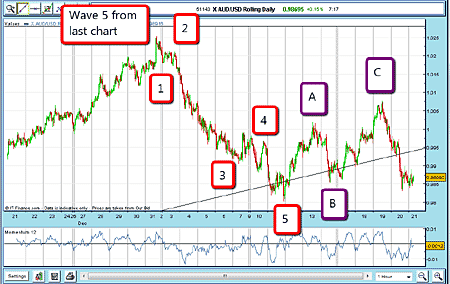
So after the rally above the Fibonacci level on 13 January (the first wave of the three-wave counter-trend), then Elliott wave analysis suggests you'd expect the market to dip back in a second wave (but not hit a lower low), and then embark on a third wave, to hit a new high probably near a Fibonacci retrace of the wave from the 31 December high to the 11 January low. That is useful to know.
In other words, you should be able to expect a new high above the 13 January high. And this is precisely what ended up happening, as you can see below.

(Click on the chart for a larger version)
The market rallied from 14-19 January (from point B to point C), where it made a high above $1.005, just pips shy of the Fibonacci 61.8% level. Taking profits near there would have produced gains of at least 250 pips on a long trade.
And now a clear A-B-C formation has been completed, which suggests the next move would be down.
Swing-trading provides so many more opportunities to profit
I hope I have shown you how you can trade these markets profitably. After using Elliott and Fibonacci for a while, just a glance at a chart can reveal the waves and the likely retracements. They seem to pop out at you!
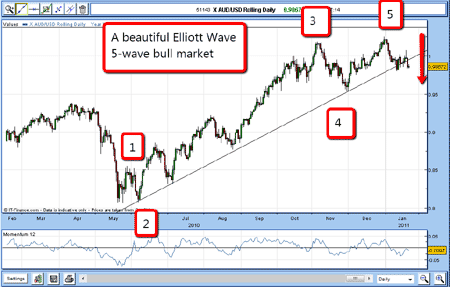
Incidentally, if you were bullish on the Aussie in early October, you would be sitting on precisely break-even on your trade. It hasn't shifted in four months, has it? (Just look at the long-term chart from my previous blog, below).

(Click on the chart for a larger version)
Yet behind the scenes, as a swing trader, you could have been taking out significant profits in both directions! That is the beauty of swing trading opportunities come along regularly.
I hope you can see how these two tools Elliott wave analysis and Fibonacci can give you an edge in your spread betting. For me, they are priceless for giving me confidence in forecasting which direction the market will probably move and the probable wave formation ahead. What more can you ask? But to get competent, as with anything else, you need practice.
NB: Don't miss my next bit of trading advice. To receive all my spread betting blog posts by email, as soon as I've written them, just sign up here .
Get the latest financial news, insights and expert analysis from our award-winning MoneyWeek team, to help you understand what really matters when it comes to your finances.
John is is a British-born lapsed PhD physicist, who previously worked for Nasa on the Mars exploration team. He is a former commodity trading advisor with the US Commodities Futures Trading Commission, and worked in a boutique futures house in California in the 1980s.
He was a partner in one of the first futures newsletter advisory services, based in Washington DC, specialising in pork bellies and currencies. John is primarily a chart-reading trader, having cut his trading teeth in the days before PCs.
As well as his work in the financial world, he has launched, run and sold several 'real' businesses producing 'real' products.
-
 Japanese stocks rise on Takaichi’s snap election landslide
Japan’s new prime minister Sanae Takaichi has won a landslide victory in a snap election, prompting optimism that her pro-growth agenda will benefit Japanese stocks
-
 Alphabet 'is planning a 100-year bond': would you back Google for 100 years?
Google owner Alphabet is reported to be joining the rare century bond club