Gold is due a major correction
As the price of gold inches up again, John C Burford sees a major sell-off in the charts. Here he explains how to play it.
Get the latest financial news, insights and expert analysis from our award-winning MoneyWeek team, to help you understand what really matters when it comes to your finances.
You are now subscribed
Your newsletter sign-up was successful
Want to add more newsletters?

Twice daily
MoneyWeek
Get the latest financial news, insights and expert analysis from our award-winning MoneyWeek team, to help you understand what really matters when it comes to your finances.

Four times a week
Look After My Bills
Sign up to our free money-saving newsletter, filled with the latest news and expert advice to help you find the best tips and deals for managing your bills. Start saving today!
Today I want to write about gold. Because I believe we are in the process of making my long-awaited major turn. And I wanted to explain exactly why I think we could soon see a major sell off in gold.
Previously, I have highlighted the crowded trade nature of the market and have been looking for short entries.
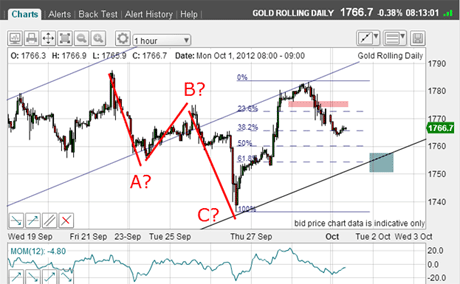
As I signed off my last article, I had a short entry, the market was heading lower and my trade was in slight profit. Below is the chart from then.
MoneyWeek
Subscribe to MoneyWeek today and get your first six magazine issues absolutely FREE

Sign up to Money Morning
Don't miss the latest investment and personal finances news, market analysis, plus money-saving tips with our free twice-daily newsletter
Don't miss the latest investment and personal finances news, market analysis, plus money-saving tips with our free twice-daily newsletter
I had my short entry at the pink bar having bounced down off the upper tramline and noted the bounce off the Fibonacci 38% retrace. I also noted the potential A-B-C pattern, which would indicate the bull market might be intact.
Those were the opposing forces at play at the time.
My downside target was the blue bar, but as we all know, the market never made it and continued its rally to take me out on my stop.

(Click on the chart for a larger version)
Was the market going on to make (and exceed?) the $1,800 level and head for the skies?
Well I am not giving up on my quest for a major turn, despite making a small loss. I am nothing if not persistent!
The warning signs for gold
As I said on 1 October, my one eye is on the Commitment of Traders (COT) data more on that shortly.
But I'm also aware of the frenzy of bullishness that has recently appeared in the blogosphere of late. I am seeing outrageous upside targets mentioned again. That is a huge warning light to me it occurred last year as gold was rallying towards $2,000, but of course, fell short by a wide margin, thereby dashing bullish hopes.
Disappointment at not hitting $2,000 produced waves of liquidation and we made hay on that decline.
Today, I am confident the market has become too one-sided and due at least a major correction. But can I find any evidence to back up my COT hunch?
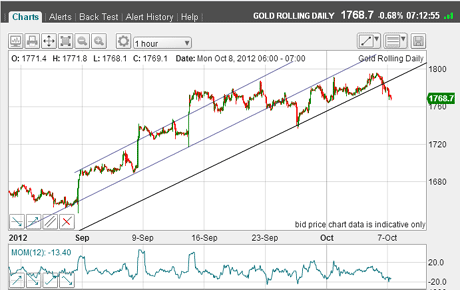
Last week, gold made a stab at the much-trumpeted round figure $1,800 and on Friday, it came within $4 and promptly backed off. Here is the chart as of this morning:

(Click on the chart for a larger version)
I have slightly re-drawn my original tramlines, but see how the market respected the lowest line on Friday and bounced up to make the $1,796 high before selling off into Friday's close.
The important point is that this sell-off has produced a crucial tramline break.
Now we are getting somewhere our first piece of evidence to suggest a major turn is at hand. But I need more and here is the latest COT data:
TABLE.ben-table TABLE {BORDER-BOTTOM: #2b1083 1px solid; BORDER-LEFT: #2b1083 1px solid; BORDER-TOP: #2b1083 1px solid; BORDER-RIGHT: #2b1083 1px solid}TH {TEXT-ALIGN: center; BORDER-LEFT: #a6a6c9 1px solid; PADDING-BOTTOM: 2px; PADDING-LEFT: 1px; PADDING-RIGHT: 1px; BACKGROUND: #2b1083; COLOR: white; FONT-SIZE: 0.8em; FONT-WEIGHT: bold; PADDING-TOP: 2px}TH.first {TEXT-ALIGN: left; BORDER-LEFT: 0px; PADDING-BOTTOM: 2px; PADDING-LEFT: 1px; PADDING-RIGHT: 1px; FONT-SIZE: 0.8em; PADDING-TOP: 2px}TR {BACKGROUND: #fff}TR.alt {BACKGROUND: #f6f5f9}TD {TEXT-ALIGN: center; BORDER-LEFT: #a6a6c9 1px solid; PADDING-BOTTOM: 2px; PADDING-LEFT: 1px; PADDING-RIGHT: 1px; COLOR: #000; FONT-SIZE: 0.8em; PADDING-TOP: 2px}TD.alt {BACKGROUND-COLOR: #f6f5f9}TD.bold {FONT-WEIGHT: bold}TH.date {FONT-SIZE: 0.7em}TD.first {TEXT-ALIGN: left}TD.left {TEXT-ALIGN: left}TD.bleft {TEXT-ALIGN: left; FONT-WEIGHT: bold}
| Contracts of 100 Troy ounces | Row 0 - Cell 1 | Row 0 - Cell 2 | Row 0 - Cell 3 | Open interest: 480,908 | ||||
| Commitments | ||||||||
| 239,434 | 31,108 | 26,727 | 136,250 | 405,520 | 402,411 | 463,355 | 78,497 | 17,553 |
| Changes from 25/9/12 (Change in open interest: -8,608) | ||||||||
| 5,440 | 1,010 | -5,914 | -8,256 | -1,341 | -8,730 | -6,245 | 122 | -2,363 |
| Percent of open in terest for each category of traders | ||||||||
| 49.8 | 6.5 | 5.6 | 28.3 | 84.3 | 83.7 | 96.4 | 16.3 | 3.6 |
| Number of traders in each category | ||||||||
| 224 | 55 | 68 | 48 | 47 | 302 | 148 | Row 8 - Cell 7 | Row 8 - Cell 8 |
Wow!The large specs (hedge funds, exchange-traded funds (ETFs)) increased their longs so that they now hold almost eight long contracts for every one short (it was seven last time). As I never tire of saying, most people (even the pros) turn more and more bullish as the market rallies.
Trader tip: In fact, the correct position is to become more bearish as markets extend rallies. It is the 'selling high' part of the universal law of profits which states: 'buy low and sell high'. How tough to put into practice as we are caught up in the bullish excitement, especially if heavily long!
Even the small specs are throwing in the towel as they covered shorts.
To me, this is a textbook set-up for a major top soon, if not already made on Friday.
So I have two solid pieces of evidence. Can I find any more?
The last piece of the picture
I believe I can and it involves Elliott waves.
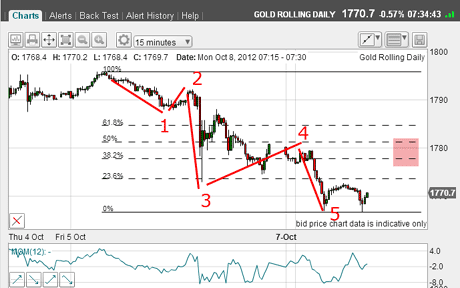
Here is a close-up on the 15-minute chart showing the form of the decline off Friday's high:

(Click on the chart for a larger version)
I can count five complete waves with wave 3 being strong (but not long). Wave 4 is complex a normal pattern and this morning, we have a new low in wave 5.
This is the pattern I have been looking for! It indicates that with high probability, the trend has now changed and I can expect a rally (in an A-B-C?) to perhaps the Fibonacci levels marked by the pink bar.
That is my third piece of evidence, so I rest my case.
And adding to my evidence is the fact that the market has rallied to the Fibonacci 62% retrace of the huge move down from last year's $1,920 high to major support at the $1,530 area.
But of course, if we do see a larger immediate sell-off, my Elliott wave labels may be part of a larger pattern with my wave 3 a larger wave 1, my wave 4 a larger wave 2 and we could be currently in a larger wave 3. That would be a very ominous development for the bulls. But my small-scale five-wave pattern still holds.
How low could gold go?
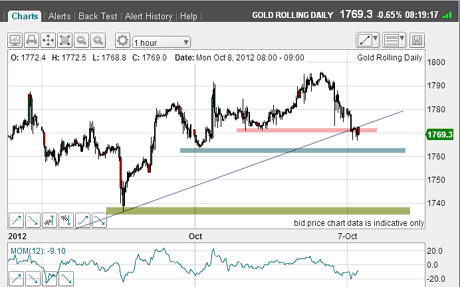
So where are the chart points that are the signs along the way to tell if we are really in a large third wave?

(Click on the chart for a larger version)
We are already working through the first area of chart support (pink bar). The next is the blue bar surrounding the next minor low, and the third is the green bar around the major low just below $1,740.
Incidentally, the further down from the common $1,800 target the market may fall, the more anxious thelongs willbe to grab profits while they are still there. This occurred last year off the $1,920 high, as the market was hit by tsunamis of panicked selling.
I sense exciting times lie ahead.
Finally, eagle-eyed readers will have noted the large negative momentum divergence at Friday's high!
If you're a new reader, or need a reminder about some of the methods I refer to in my trades, then do have a look at my introductory videos:
The essentials of tramline trading
An introduction to Elliott wave theory
Advanced trading with Elliott waves
Don't miss my next trading insight. To receive all my spread betting blog posts by email, as soon as I've written them, just sign up here . If you have any queries regarding MoneyWeek Trader, please contact us here.
Get the latest financial news, insights and expert analysis from our award-winning MoneyWeek team, to help you understand what really matters when it comes to your finances.
John is is a British-born lapsed PhD physicist, who previously worked for Nasa on the Mars exploration team. He is a former commodity trading advisor with the US Commodities Futures Trading Commission, and worked in a boutique futures house in California in the 1980s.
He was a partner in one of the first futures newsletter advisory services, based in Washington DC, specialising in pork bellies and currencies. John is primarily a chart-reading trader, having cut his trading teeth in the days before PCs.
As well as his work in the financial world, he has launched, run and sold several 'real' businesses producing 'real' products.
-
 Average UK house price reaches £300,000 for first time, Halifax says
While the average house price has topped £300k, regional disparities still remain, Halifax finds.
-
 Barings Emerging Europe trust bounces back from Russia woes
Barings Emerging Europe trust has added the Middle East and Africa to its mandate, delivering a strong recovery, says Max King