What is a ‘head and shoulders’ pattern?
'Head and shoulders' is a useful charting concept that spread betters can use in short-term trading. John C Burford explains how.
Get the latest financial news, insights and expert analysis from our award-winning MoneyWeek team, to help you understand what really matters when it comes to your finances.
You are now subscribed
Your newsletter sign-up was successful
Want to add more newsletters?

Twice daily
MoneyWeek
Get the latest financial news, insights and expert analysis from our award-winning MoneyWeek team, to help you understand what really matters when it comes to your finances.

Four times a week
Look After My Bills
Sign up to our free money-saving newsletter, filled with the latest news and expert advice to help you find the best tips and deals for managing your bills. Start saving today!
I have been asked to expand a little on the chart formation known as the 'Head and Shoulders' (H&S). Most traders will have heard of this pattern, but they may not be aware that the concept can be employed in a modified form in short-term trading. So today I'd like to show you how I use it in my trading.
No self-respecting chartist of my era would dream of not searching for H&S patterns at the suspected end of a major bull or bear trend. Below is an example of what a good one looks like and it's a real corker!
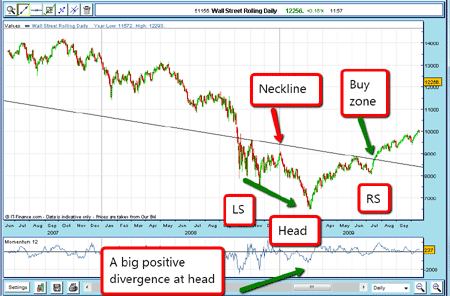
The chart shows the daily Dow in 2008-2009. It shows the huge bear market starting at the all-time high at over 14,000 to the 6,500 low made in March 2009. From the rally high in early November, the market then plunged to make the new low but on a huge positive divergence with momentum. Remember, this is often a signal to look out for a change of trend up ahead.
MoneyWeek
Subscribe to MoneyWeek today and get your first six magazine issues absolutely FREE

Sign up to Money Morning
Don't miss the latest investment and personal finances news, market analysis, plus money-saving tips with our free twice-daily newsletter
Don't miss the latest investment and personal finances news, market analysis, plus money-saving tips with our free twice-daily newsletter
(Click on the image for a larger version)
From the low, the market rallied to make an interim high in mid-June. It then dipped again, then resumed the new uptrend.
I have drawn a line joining the interim highs. This line is called the neckline, as the formation beneath it resembles a shoulder on the left (LS), a head (the actual low), and a right shoulder (RS). When a bear market is ending, the head is always below both shoulders. When a bull market is ending, it's the other way around. A standard trade would be to buy when the neckline is penetrated after forming the RS.
How far should the rally take the market?
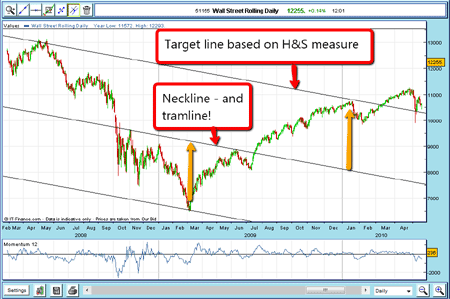
OK, so how far can we expect the rally to carry? Again, standard H&S theory states that at a minimum, the market will rally to a place equal in distance (in price) from the neckline extension as the head is away from the neckline. I have marked these distances with yellow arrows. Does it make it?
(Click on the image for a larger version)
Yes, indeed, the target was hit exactly in January 2010 for a nice 900 point gain. Also, note that the upper target line for my H&S measure also acts as one of my tramlines there is a real structure to the markets.
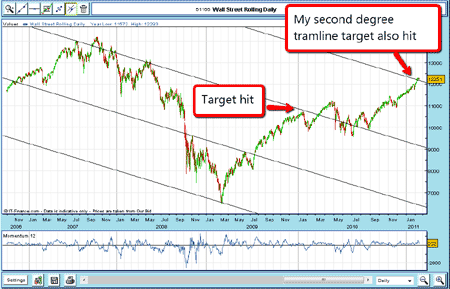
Now let's bring this up to date (to mid-February 2011). Here's where it gets really interesting. If I draw another tramline equidistant from the last one, this is what I find:
(Click on the image for a larger version)
In the past few days, the Dow has carried right up to this new line at the 12,300 area. Isn't that pretty? The really fascinating thing is that I could have figured out this precise target line way back in the summer of 2009 almost two years ago from a simple measurement derived from the H&S pattern. That's valuable information.
Now this example shows the classic chartist picture of the H&S. But I also use these ideas on short-term charts where they can occur not necessarily at the end of big moves. It's my own little variation on the H&S theme.
Using the head and shoulders pattern in short-term trading
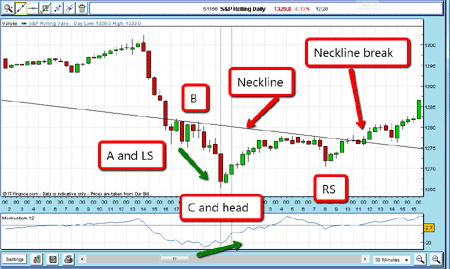
Here is a chart of the S&P 500 (at the end of January 2011), which is in a bull market:
(Click on the image for a larger version)
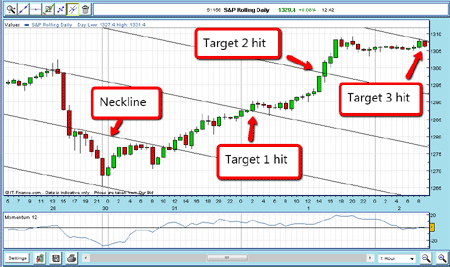
The market is in a normal corrective period and has made a typical three Elliott wave (A-B-C) dip to the 1,265 low (marked head and wave C). The market rallied, then dipped to the RS, where I could then draw a neckline between the two interim highs. Buy orders can then be entered as the market moved up through the neckline.
Now that there's a confirmed H&S pattern, is it possible to figure out some price targets by putting more tramlines in place? Well, just look at how trading developed from there:
(Click on the image for a larger version)
Since the market was already in a bull market, we shouldn't be surprised to see it just take off and look at how it has hit all the targets. These targets are derived in exactly the same way as in the Dow example above. Again a very pretty picture.
When I spot a potential H&S pattern, I draw my neckline (which often acts as one of my tramlines), and then draw my equidistant parallel lines to give me likely targets for profit-taking.
I don't want too many lines on your chart, especially if I draw in the Fibonacci retrace levels as well. I generally keep two charts going on the same market and switch back and forth, especially for short-term trading.
Get the latest financial news, insights and expert analysis from our award-winning MoneyWeek team, to help you understand what really matters when it comes to your finances.
John is is a British-born lapsed PhD physicist, who previously worked for Nasa on the Mars exploration team. He is a former commodity trading advisor with the US Commodities Futures Trading Commission, and worked in a boutique futures house in California in the 1980s.
He was a partner in one of the first futures newsletter advisory services, based in Washington DC, specialising in pork bellies and currencies. John is primarily a chart-reading trader, having cut his trading teeth in the days before PCs.
As well as his work in the financial world, he has launched, run and sold several 'real' businesses producing 'real' products.
-
 Average UK house price reaches £300,000 for first time, Halifax says
While the average house price has topped £300k, regional disparities still remain, Halifax finds.
-
 Barings Emerging Europe trust bounces back from Russia woes
Barings Emerging Europe trust has added the Middle East and Africa to its mandate, delivering a strong recovery, says Max King