Using Elliott wave and Fibonacci analysis in short-term trading
In spread betting, it is easy to get over-excited about a trade. But over-trading is one of the greatest sins any spread-better can make. Here's how to use Elliott wave and Fibonacci analysis to tell when a trade is ripe for picking.
Get the latest financial news, insights and expert analysis from our award-winning MoneyWeek team, to help you understand what really matters when it comes to your finances.
You are now subscribed
Your newsletter sign-up was successful
Want to add more newsletters?

Twice daily
MoneyWeek
Get the latest financial news, insights and expert analysis from our award-winning MoneyWeek team, to help you understand what really matters when it comes to your finances.

Four times a week
Look After My Bills
Sign up to our free money-saving newsletter, filled with the latest news and expert advice to help you find the best tips and deals for managing your bills. Start saving today!
As an active trader, I am always on the lookout for trading opportunities from short-term (up to four days) to long-term (days and weeks). Sometimes I'll be stalking a trade for several days or even weeks before an ideal set-up presents itself.
However, I'll confess that there's always the temptation to jump the gun before all my ducks are lined up. And in my earlier days, I would get over-excited about a trade my emotions would get the better of my judgement.
But I have learned to control my impulsive urges at least, most of the time. And if you are prone to impatience, I would urge you to make an effort to keep your finger off that 'trade' button until the last moment. Over-trading is one of the greatest sins any trader can make, let me assure you.
MoneyWeek
Subscribe to MoneyWeek today and get your first six magazine issues absolutely FREE

Sign up to Money Morning
Don't miss the latest investment and personal finances news, market analysis, plus money-saving tips with our free twice-daily newsletter
Don't miss the latest investment and personal finances news, market analysis, plus money-saving tips with our free twice-daily newsletter
That's why I have developed my very simple money management rules. Adhering to them will keep any trader honest!
So what tells you that a trade is ripe for picking?
Even in short-term charts, minor Elliott waves are clearly present as are the Fibonacci retracements and projections.
Here is a great recent example in the euro (EUR) / dollar (USD).
Throughout the summer, the dollar was hit hard as the newly-printed $1 trillion of quantitative easing (QE) flooded the US banking system. That sum represented around 6% of US annual GDP a truly staggering amount. It hit the system like a tsunami, leading to huge asset market rallies.
Even junk bond prices have surged, pushing yields down. Just a few months ago, any junk bond was the hottest potato on the board. Now, investors wanted yield and to heck with the quality of the asset.
It reminded me of the days before the credit crunch when mortgage-backed securities were the rage. I have a feeling the end result will be identical.
Meanwhile, all that QE had the impact you'd expect on the dollar. It sent it tumbling. The dollar index fell from around 89 to a low of around 77 in October a decline of 13.5%.
Naturally, the euro mirrored the huge move by rallying. Now, I already knew that the euro was in a long-term downtrend against the dollar, so I was looking for a spot to short it.
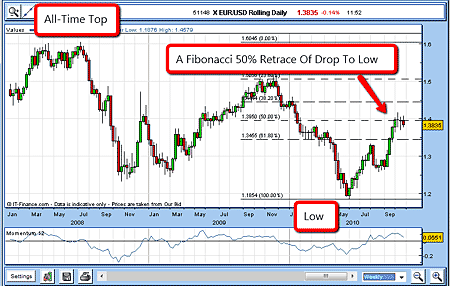
The chart below shows the position on the weekly chart, showing the Fibonacci retracement levels from the all-time high in 2008 (marked 'all-time top') to the recent low in June (marked 'low'):

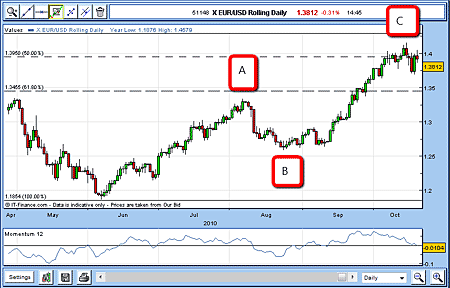
When looking to short into a rally, I look to do so around the Fibonacci retracement levels, as rallies often reverse on or around here. The summer rally had made a clear three-wave pattern (marked A-B-C on the chart below) up to the 50% retrace level by mid-October. Also, the momentum readings were getting over-stretched, indicating that the market would very likely pause at the $1.40 area.

Then on 14 October, the market broke through the $1.41 level and I began watching it much more closely. As a measure of the validity of the move, the action on the day following is very often a give-away. On the 15th, the market began retreating, which gave me a signal that the rally had likely turned around. I decided to enter my short trade on the retreat.
How patience can really pay off
I was willing to risk 50 pips, which is a close stop, since if the 50% Fibonacci level was not to hold, the market would likely move up to the 62.8% retrace at 1.44.
I did not want to be short on that move! Because of the close stop, I decided to bet £2 a point because:
A Fibonacci level had been reached;
Momentum readings were severely overstretched;
Bullish sentiment in the market was over 95% (trade-futures.com) an extreme;
The wave C up would end at the 1.4050 area if wave C = wave A (a very common measure);
The final move up occurred in five waves (always an ending pattern marked 1-2-3-4-5 on the chart a bit further below). I could expect a three-wave corrective pattern down.
My ducks had lined up! It was tempting to short it shy of the Fibonacci level, but patience paid off.
Here is my trade:
15 Oct sold £2 euro/dollar rolling @ 1.4030
Stop @ 1.4080
Risk £100 (2% of account capital)
The market did top out there and started falling. I moved my protective stop to follow my break-even rule and watched as the market moved my way.
Now what could I expect? In all likelihood, an A-B-C pattern down (a three-wave Elliott pattern), and then a rally.
Since this was intended as a short-term trade (because the reversals on a daily chart are often messy) my goal was to take profits on a target. But what should my target be? On the 18th, the market rallied, and then fell into new low ground for the move an A-B-C pattern was now on the cards.
The commonest relationship for an A-B-C pattern is for wave C to equal in price difference wave A. In other words, the distance from the top (marked 5 on the chart below) to point A on the first wave will equal the distance between point B and point C. This applies in any time-frame if you look above, you'll see it was the same on the weekly chart!
This projected wave C to the 1.3670 level. In other words, it suggested that wave C would bottom at 1.3670.

On the 20th, the market made an attempt to break below the 1.37 level, but had trouble pushing through. It appeared the 1.3670 level was not to be, at least on this attempt. It was a tantalising 30 pips away, but I decided then to cover my shorts at 1.3750 and grab the profit.
20 Oct covered £2 euro/dollar rolling @ 1.3750.
Profit £560 (risk £100)
That trade was set up by a long-term Fibonacci retracement, short-term Elliott wave patterns, and a short-term Fibonacci retracement.
Get the latest financial news, insights and expert analysis from our award-winning MoneyWeek team, to help you understand what really matters when it comes to your finances.
John is is a British-born lapsed PhD physicist, who previously worked for Nasa on the Mars exploration team. He is a former commodity trading advisor with the US Commodities Futures Trading Commission, and worked in a boutique futures house in California in the 1980s.
He was a partner in one of the first futures newsletter advisory services, based in Washington DC, specialising in pork bellies and currencies. John is primarily a chart-reading trader, having cut his trading teeth in the days before PCs.
As well as his work in the financial world, he has launched, run and sold several 'real' businesses producing 'real' products.
-
 ISA fund and trust picks for every type of investor – which could work for you?
Whether you’re an ISA investor seeking reliable returns, looking to add a bit more risk to your portfolio or are new to investing, MoneyWeek asked the experts for funds and investment trusts you could consider in 2026
-
 The most popular fund sectors of 2025 as investor outflows continue
It was another difficult year for fund inflows but there are signs that investors are returning to the financial markets