Pressure’s mounting – the pound could be set to shoot up
John C Burford turns to Elliott wave theory to explain why the pound is on the verge of a sharp move up against the dollar.
Get the latest financial news, insights and expert analysis from our award-winning MoneyWeek team, to help you understand what really matters when it comes to your finances.
You are now subscribed
Your newsletter sign-up was successful
Want to add more newsletters?

Twice daily
MoneyWeek
Get the latest financial news, insights and expert analysis from our award-winning MoneyWeek team, to help you understand what really matters when it comes to your finances.

Four times a week
Look After My Bills
Sign up to our free money-saving newsletter, filled with the latest news and expert advice to help you find the best tips and deals for managing your bills. Start saving today!
In recent posts, I have given extensive coverage of the euro, so today I will turn my attention to the pound, which is also offering some terrific lessons in reading the charts.
As always, I like to begin with the long-term chart, because with an understanding of the history of the market, you can more easily assess where in the wave development the market presently resides.
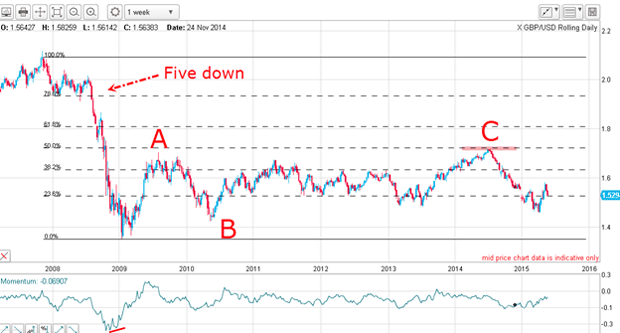
The weekly chart below stretches back to 2007, just before the crash. We can see that the market staged a lovely five down to the January 2009 low (on a momentum divergence). Since then, it had been in one huge A-B-C consolidation zone until last year, when the market got very excited by the imminent demise of the dollar and the economic recovery in the UK.
MoneyWeek
Subscribe to MoneyWeek today and get your first six magazine issues absolutely FREE

Sign up to Money Morning
Don't miss the latest investment and personal finances news, market analysis, plus money-saving tips with our free twice-daily newsletter
Don't miss the latest investment and personal finances news, market analysis, plus money-saving tips with our free twice-daily newsletter

That was the time when bullish dollar sentiment reached rock-bottom. Of course, that was the ideal scenario for the dollar to stage a huge rally, which is still ongoing. And what a convenient excuse for the gods to push the market up to the final C wave top.
This 2014 rally topped out at the 1.72 level, which was just shy of the Fibonacci 62% retrace a common turning point for corrective moves. Remember, with that historic five down plunge in 2008, the subsequent move is corrective, not impulsive. That gives the backdrop as bearish and swing traders should trade accordingly.
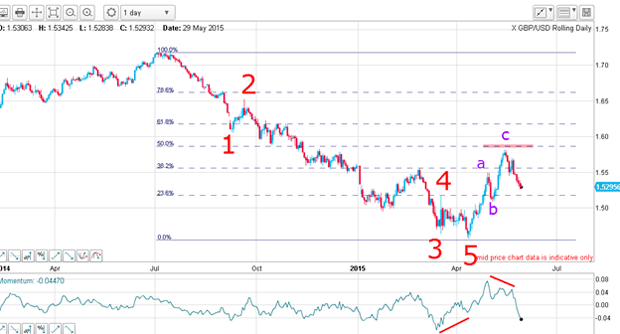
From that 1.72 top in July last year, it was almost straight down to the April low at the 1.46 level. That was one superb swing trade!
This bear move occurred in five motive waves, which implied that when complete, a corrective upward phase would begin and this could offer some excellent trading opportunities. For instance, there is a huge positive-momentum divergence on the daily chart:

And that is always a warning to expect a sharp snap-back rally, which occurred right on cue. That was one excellent opportunity.
This current rally is a corrective move, which implies an A-B-C or some other form of three up and that occurred on cue as the market rallied to the 14 May high.
And if I label the corrective rally in this way, I have a good negative-momentum divergence at the C wave high. That heralds a sharp move down and another great trade.
Note that the C wave has not reached the Fibonacci 50% level. That could be very significant because it leaves the door open to the possibility that the market could catch a bid and move up to that level or even the Fibonacci 62%!
A rare gap in the chart hinted at a downturn
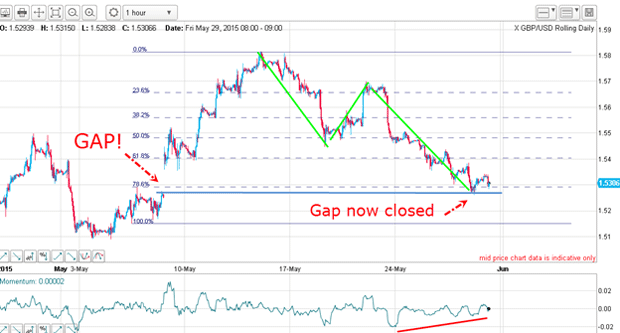
Looking at the move down (with the main trend) off this top, the market has traced out another three down in an A-B-C form on the hourly:

But this chart is showing a very unusual feature a large gap. Because FX (foreign exchange) markets now trade virtually 24-hours but not Saturdays and most of Sundays the only time a significant gap occurs will be over the weekend. But when it does, it indicates there was a market-moving event that weekend when markets were closed.
Of course, in pre-electronic trading days of yore, gaps were very common and have been studied extensively by the early chartists and found to be of various types. One of the main features they found is that with a runaway gap (as this one was), it acts as a magnet which eventually draws prices back to the gap.
When that happens, the market will either close the gap, or make a turn at the gap's edge.
So today, the market has moved beyond the gap edge and has just closed the gap.
One other factor to note is that there is a large positive-momentum divergence (red bars). This indicates selling pressure is waning. But will that be enough to turn the market around here?
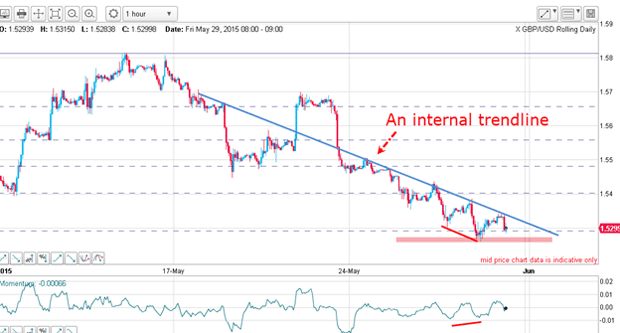
Let's take an even closer look. The latest move down has been running along this little internal trendline and with this momentum divergence appearing as the market closed the gap, the pressure is building for an explosive move.

Students who have just enrolled in the Trade for Profit Academy will know just how to play this setup!
Get the latest financial news, insights and expert analysis from our award-winning MoneyWeek team, to help you understand what really matters when it comes to your finances.
John is is a British-born lapsed PhD physicist, who previously worked for Nasa on the Mars exploration team. He is a former commodity trading advisor with the US Commodities Futures Trading Commission, and worked in a boutique futures house in California in the 1980s.
He was a partner in one of the first futures newsletter advisory services, based in Washington DC, specialising in pork bellies and currencies. John is primarily a chart-reading trader, having cut his trading teeth in the days before PCs.
As well as his work in the financial world, he has launched, run and sold several 'real' businesses producing 'real' products.
-
 ISA fund and trust picks for every type of investor – which could work for you?
Whether you’re an ISA investor seeking reliable returns, looking to add a bit more risk to your portfolio or are new to investing, MoneyWeek asked the experts for funds and investment trusts you could consider in 2026
-
 The most popular fund sectors of 2025 as investor outflows continue
It was another difficult year for fund inflows but there are signs that investors are returning to the financial markets