My euro tramlines look good, but I’m not trading yet
The moment of truth has arrived for the euro. John C Burford watches for the fog to clear, and his next entry into the market.
Get the latest financial news, insights and expert analysis from our award-winning MoneyWeek team, to help you understand what really matters when it comes to your finances.
You are now subscribed
Your newsletter sign-up was successful
Want to add more newsletters?

Twice daily
MoneyWeek
Get the latest financial news, insights and expert analysis from our award-winning MoneyWeek team, to help you understand what really matters when it comes to your finances.

Four times a week
Look After My Bills
Sign up to our free money-saving newsletter, filled with the latest news and expert advice to help you find the best tips and deals for managing your bills. Start saving today!
I want to start this week by continuing my euro coverage. The euro is still giving us some lovely lessons in chart analysis. Those lessons will give us a clearer picture of where the euro might head, but they can also be transferred to other markets.
On Friday, I took all remaining profits on my short EUR/USD. I believed the market had reached a significant support level around the 1.09 print, so I decided to stand aside for a little while.
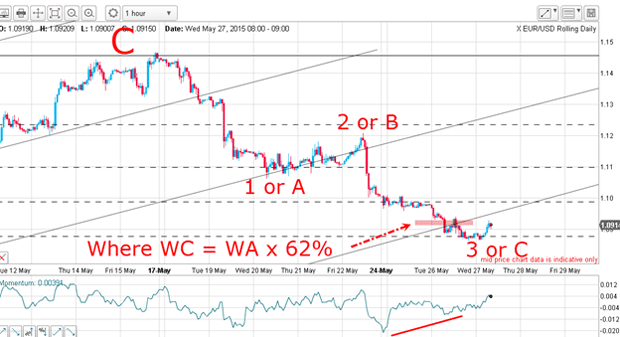
On Friday morning's chart, it was clear that the decline off the C wave high was in three waves so far. My question was this: was an A-B-C developing, or was it the 1-2-3 of a five down? The market had hit Fibonacci support at the 62% level (the most common turning point for retracements) at 1.09 and there was a solid positive-momentum divergence forming:
MoneyWeek
Subscribe to MoneyWeek today and get your first six magazine issues absolutely FREE

Sign up to Money Morning
Don't miss the latest investment and personal finances news, market analysis, plus money-saving tips with our free twice-daily newsletter
Don't miss the latest investment and personal finances news, market analysis, plus money-saving tips with our free twice-daily newsletter

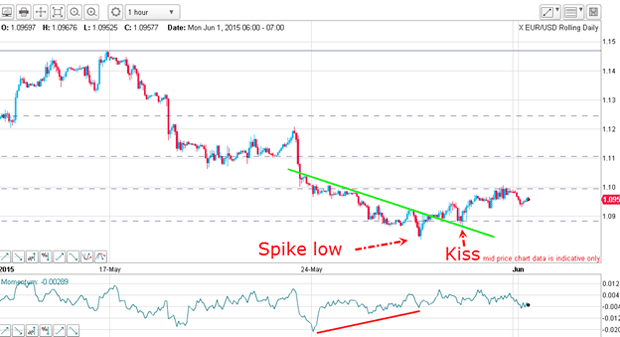
The odds were stacking up in favour of a bounce of some kind. On Friday morning, we got it.
A trendline kiss confirmed the market uptrend

It was possible to draw that line because there was a sufficient number of highs to validate that line of resistance. I like to see at least three highs (or lows) to accurately touch my line before I have confidence in it.
Later on Friday, the market broke up above that line of resistance and it immediately became a line of support.When it planted a kiss on that line and moved up away, my green line was validated as a reliable line of support. I could start anticipating a rally phase.
But how big would the rally be?
My setup looks solid but I'm waiting for a giveaway

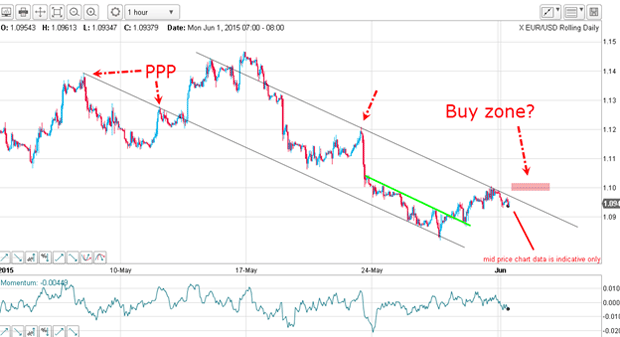
I started with the lower tramline and identified the two prior pivot points (PPPs) as potentially lying on my line. Last Friday's low as a major touch point.
I used my parallel line tool and adjusted upwards until I found the major high on 22 May, which is my wave 2 or B. And gratifyingly, the upper tramline passes through some major highs. I can rely on this pair now.
Remember, I like to see a solid PPP on at least one of the lines in order to have confidence.
Note that my mini trendline (green) lies parallel with my new tramlines a sure validation of all of my lines. That is something you should always look for in your charts. The more validation you can provide, the greater the confidence you can have in your main tramlines.
So with the market toying with this upper tramline resistance, the question is: will the market break up through it, or will it bounce off this resistance and move lower?
If we see an upside break, that would help confirm the A-B-C interpretation. But if it moves lower, it would help the five down case.
My trading set-up gives me alternatives that's one of its key strengths
As I write, the market is at such a point. A short trade placed when the market is at or near the upper tramline could be protected by a stop-loss placed just above the line.
In fact, such a break should signal that a more protracted rally is on the cards and a long trade here would be indicated.
But if the market moves lower from here, the odds lengthen for a move towards the lower tramline.
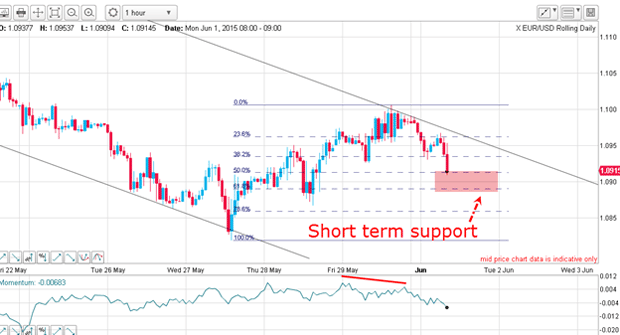
As I write, the market has moved down off tramline resistance and is entering the Fibonacci 50% - 62% support zone:

This is the moment of truth. If the market moves below this zone, odds are long that new lows are in store. But if it bounces up from here and tests the upper tramline again, we would have a small three down in this morning's trading and a likely successful break above the tramline.
But remember what I wrote a few days ago we are now in a difficult trading area and the easy' money has been made. I still expect to see rapid up/down waves which will be very difficult to trade until the fog clears, that is.
Get the latest financial news, insights and expert analysis from our award-winning MoneyWeek team, to help you understand what really matters when it comes to your finances.
John is is a British-born lapsed PhD physicist, who previously worked for Nasa on the Mars exploration team. He is a former commodity trading advisor with the US Commodities Futures Trading Commission, and worked in a boutique futures house in California in the 1980s.
He was a partner in one of the first futures newsletter advisory services, based in Washington DC, specialising in pork bellies and currencies. John is primarily a chart-reading trader, having cut his trading teeth in the days before PCs.
As well as his work in the financial world, he has launched, run and sold several 'real' businesses producing 'real' products.
-
 MoneyWeek Talks: The funds to choose in 2026
Podcast Fidelity's Tom Stevenson reveals his top three funds for 2026 for your ISA or self-invested personal pension
-
 Three companies with deep economic moats to buy now
Opinion An economic moat can underpin a company's future returns. Here, Imran Sattar, portfolio manager at Edinburgh Investment Trust, selects three stocks to buy now