Making more hay in the Dow Jones
Elliott wave theory can alert you to major impending changes of direction in the markets. Here, John C Burford explains how it works.
Get the latest financial news, insights and expert analysis from our award-winning MoneyWeek team, to help you understand what really matters when it comes to your finances.
You are now subscribed
Your newsletter sign-up was successful
Want to add more newsletters?

Twice daily
MoneyWeek
Get the latest financial news, insights and expert analysis from our award-winning MoneyWeek team, to help you understand what really matters when it comes to your finances.

Four times a week
Look After My Bills
Sign up to our free money-saving newsletter, filled with the latest news and expert advice to help you find the best tips and deals for managing your bills. Start saving today!
On Wednesday, I noted that the Dow had fallen in four waves. That meant the decline had not fully run its course. Those wave labels enabled me to reverse my position and go long in anticipation of the big rally which is now in progress.
Today, I want to show you how to do this. When you read Elliott waves (EW) correctly, it can provide vital forecasts that can help you extract major profits from the markets.
How to know when the market is about to rally
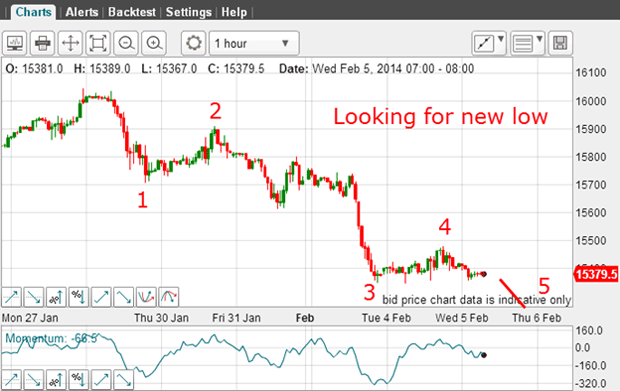
I had everything in place from an EW perspective: My wave 3 was long and certainly strong, and the wave 4 was weak. This is typical behaviour of an incomplete pattern. That's why I felt confident that there was a new low still to come.
MoneyWeek
Subscribe to MoneyWeek today and get your first six magazine issues absolutely FREE

Sign up to Money Morning
Don't miss the latest investment and personal finances news, market analysis, plus money-saving tips with our free twice-daily newsletter
Don't miss the latest investment and personal finances news, market analysis, plus money-saving tips with our free twice-daily newsletter
Because I also follow the Nasdaq in parallel with the Dow a practice I recommend you also do I noted that a new low was indeed being made late on Wednesday. And this low was a spike move a quick move down and then an equally swift move back up.
This was the chart I took early on Thursday:
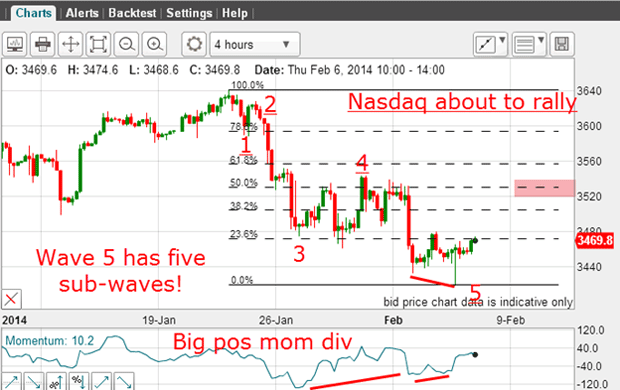
The five waves down are very clear as are the five sub-waves within the fifth wave. On top of that, there are two positive-momentum divergences working. The larger one is between the waves 3 and 5 as marked, and the smaller one is between the waves 3 and 5 sub-waves of the larger wave 5.
To me, this was a massive signal that the market was about to rally.
On Wednesday I wrote: "As of this morning, my best guess is for a slight new spike low in the next few hours, and then a rally of some magnitude can begin." The chart above clearly demonstrates that we had the spike low (see the pigtail on the lowest price bar). And it occurred within my expected timeframe.
My forecast then was for a rally to at least the Fibonacci 50% level (pink bar).
This is the position in the Nasdaq this morning:
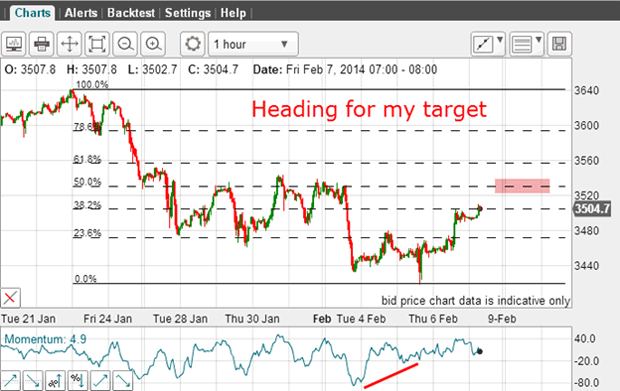
As expected, the market has rallied and has already reached the Fibonacci 38% level. Now it's heading for my 50% target.
The spike low is an important signal
The spike low in the Nasdaq was enough for me to tighten protect-profit stops. So that's why I moved them to the 15,420 level, which was just above the most recent minor high:
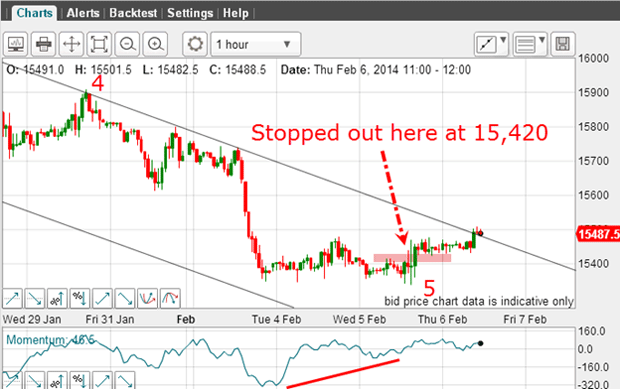
That trade gave me an additional over-1,000-pip profit. But that's not all. Because of the clear message that the market really wanted to rally, I reversed my position and went long at 15,420. And when the market rallied to my tramline and then moved above it, I felt confident a vigorous rally was in place.
And this is the position this morning:
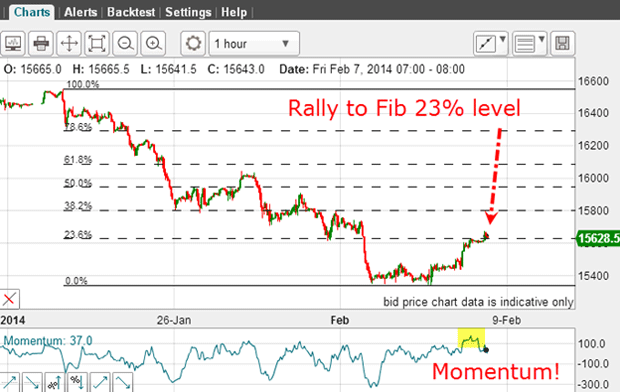
The market has rallied to the Fibonacci 23% level and into chart resistance. That means it is now short-term overbought with an extreme momentum reading. Because of this, I have taken a profit on my long trade on one half of my position at the 15,640 level for a gain of 220 pips. This is in addition to my profits on the previous short trades.
Why this trade is a win-win for me
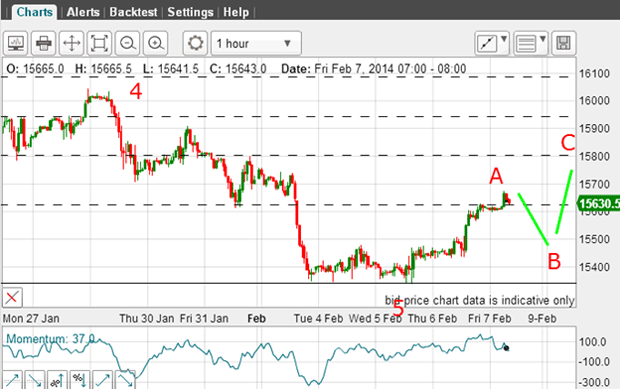
This is my best guess as of this morning. Later today, all eyes will be on the US employment data report. And that will likely increase volatility. Because the market has already rallied in anticipation of a good' figure, the odds favour a decline following the report from near current levels in a B wave. There, it should meet support and rally again in a C wave, which may extend to the Fibonacci 38% level near 15,800.
Of course, the market may love the data and rally further, thereby aiding my long trade. So it's a win-win for me.
Why this is my most bullish interpretation
This is my most bullish interpretation for the near-term. But because we have a clear five down in all stock indexes, I do not expect this rally to last. In the meantime, I am making hay on my long trade while it lasts.
I hope you see how a study of Elliott waves can hone your trade entry skills and get the direction right into the bargain.
Get the latest financial news, insights and expert analysis from our award-winning MoneyWeek team, to help you understand what really matters when it comes to your finances.
John is is a British-born lapsed PhD physicist, who previously worked for Nasa on the Mars exploration team. He is a former commodity trading advisor with the US Commodities Futures Trading Commission, and worked in a boutique futures house in California in the 1980s.
He was a partner in one of the first futures newsletter advisory services, based in Washington DC, specialising in pork bellies and currencies. John is primarily a chart-reading trader, having cut his trading teeth in the days before PCs.
As well as his work in the financial world, he has launched, run and sold several 'real' businesses producing 'real' products.
-
 MoneyWeek Talks: The funds to choose in 2026
Podcast Fidelity's Tom Stevenson reveals his top three funds for 2026 for your ISA or self-invested personal pension
-
 Three companies with deep economic moats to buy now
Opinion An economic moat can underpin a company's future returns. Here, Imran Sattar, portfolio manager at Edinburgh Investment Trust, selects three stocks to buy now