It’s almost crunch time for Greece
With Greece on the edge, the markets are looking volatile. John C Burford uses his chart-trading methods to plot a path through the chaos.
Get the latest financial news, insights and expert analysis from our award-winning MoneyWeek team, to help you understand what really matters when it comes to your finances.
You are now subscribed
Your newsletter sign-up was successful
Want to add more newsletters?

Twice daily
MoneyWeek
Get the latest financial news, insights and expert analysis from our award-winning MoneyWeek team, to help you understand what really matters when it comes to your finances.

Four times a week
Look After My Bills
Sign up to our free money-saving newsletter, filled with the latest news and expert advice to help you find the best tips and deals for managing your bills. Start saving today!
It has never been a question of if Greece would default on its payments, but when. And now, the day of reckoning has suddenly loomed closer. Greece's banks will be shut all week, and capital controls have been imposed on its citizens. That act is always the first step towards default and is, of course, deflationary, with a negative influence on stockmarkets.
There is no way in the rational world that Greece's economy could be expected to grow at such a rate that it could maintain its massive debt payments while still in the euro. And while the country is gripped by austerity.
It seems the immovable object (ie, the policy of extend and pretend' by the eurozone authorities) has met the unstoppable force (ie, eurozone breakup).
MoneyWeek
Subscribe to MoneyWeek today and get your first six magazine issues absolutely FREE

Sign up to Money Morning
Don't miss the latest investment and personal finances news, market analysis, plus money-saving tips with our free twice-daily newsletter
Don't miss the latest investment and personal finances news, market analysis, plus money-saving tips with our free twice-daily newsletter
Make no mistake with Greece's creditors' attitudes hardening, the mood music has changed. This signals that asset markets are in deep trouble, having grown on the stimulus of cheap and easy money/credit. No longer do they seem intent on the extend and pretend' policies of the past. And if they have decided not to throw good money after bad, that is a very negative signal for asset markets.
The global debt pile is so large that total outstanding debt is reckoned to have grown from $53trn in 2009 to today's pile at $59trn. With interest rates on the cusp of rising, much of this debt will never be repaid let alone maintaining interest payments.
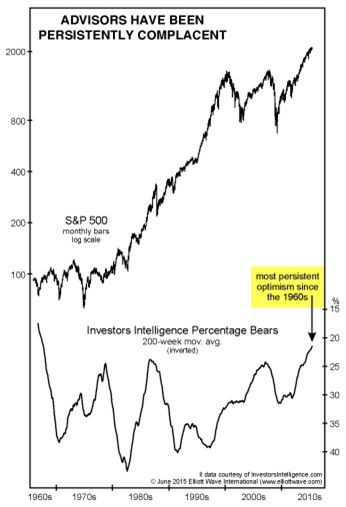
Debt it soaring, but US investors are still bullish

Chart courtesy ofwww.elliottwave.com
Not only that, but US retail investors have been largely sanguine about the market (it has been a professional's market for some time and trading volumes have been subdued). The latest AAII data shows 'mom and pop' investors have suddenly got the urge to invest and they have turned very bullish.
Data (from aaii.com) to 24 June show that the bulls/bears ratio has risen to 35%/22% (1.6), whereas the historical average is 39%/30% (1.3).
This ratio seems to be fulfilling its usual function, as a contrary indicator, in spades.
The stockmarkets' reaction over the weekend has been decisive, and today promises to be a very volatile session. I can't help but wonder whether the 'plunge protection team' has been hastily convened to stop a massacre in US markets?
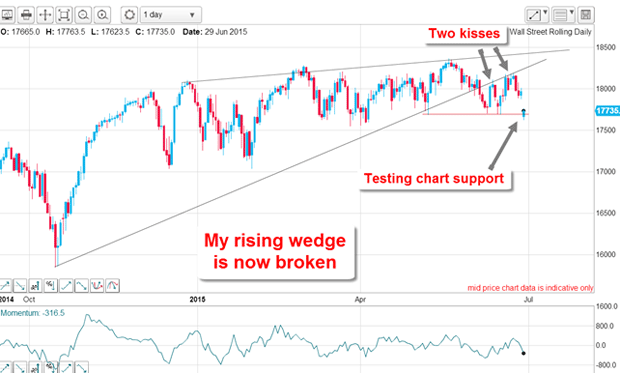
This is how I anticipated a big reversal in the Dow
Now, with the market falling hard, it has bounced swiftly off the second kiss in a classic scalded-cat bounce. This is one of my favourite patterns in which the market breaks the support of the wedge line, tries to get back above it, but can only manage a kiss because this line has been transformed into resistance. It then moves sharply away, as a cat would when scalded!

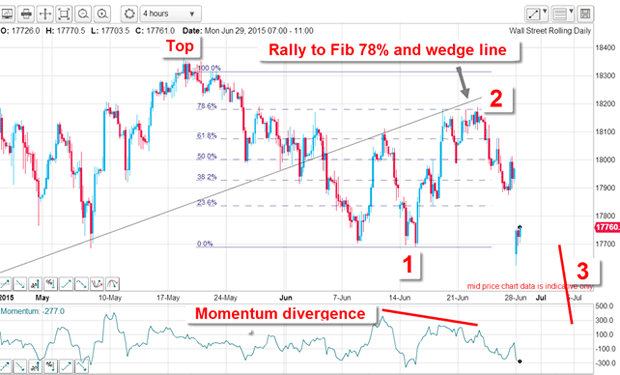
If indeed I have caught the top, do the waves off it tell me anything instructive?
Below is the hourly chart, showing a close-up of the two kisses, with the second kiss turning at the meeting of the Fibonacci 78% and wedge line. This was strong resistance. Also, the market was rapidly losing momentum into that event, giving me warning to expect a turn.
So now I can attach labels to the waves off the top. If I am correct, we are at the start of a large wave 3 and the gap down this morning adds to this interpretation, because third waves are long and strong and this morning's action is certainly strong.

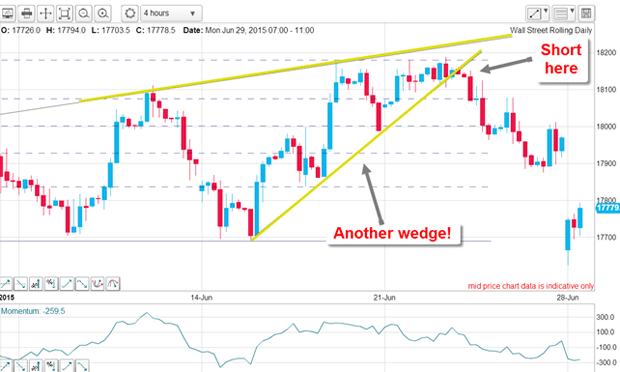
But did I anticipate this plunge? The latest rally occurred within a small rising wedge:

When the lower wedge line was broken on 23 June, that was my signal to go short.
You may have noticed that I have been describing several wedge patterns in the stock indexes. These are often ideal forewarning flags of big reversals up ahead and so it is proving.
Get the latest financial news, insights and expert analysis from our award-winning MoneyWeek team, to help you understand what really matters when it comes to your finances.
John is is a British-born lapsed PhD physicist, who previously worked for Nasa on the Mars exploration team. He is a former commodity trading advisor with the US Commodities Futures Trading Commission, and worked in a boutique futures house in California in the 1980s.
He was a partner in one of the first futures newsletter advisory services, based in Washington DC, specialising in pork bellies and currencies. John is primarily a chart-reading trader, having cut his trading teeth in the days before PCs.
As well as his work in the financial world, he has launched, run and sold several 'real' businesses producing 'real' products.
-
 Average UK house price reaches £300,000 for first time, Halifax says
While the average house price has topped £300k, regional disparities still remain, Halifax finds.
-
 Barings Emerging Europe trust bounces back from Russia woes
Barings Emerging Europe trust has added the Middle East and Africa to its mandate, delivering a strong recovery, says Max King