This ‘Santa Rally’ could be a classic bull trap
Christmas has come early for stockmarket investors. But the 'Santa Rally' could be a classic bull trap, says spread betting expert John C Burford.
Get the latest financial news, insights and expert analysis from our award-winning MoneyWeek team, to help you understand what really matters when it comes to your finances.
You are now subscribed
Your newsletter sign-up was successful
Want to add more newsletters?

Twice daily
MoneyWeek
Get the latest financial news, insights and expert analysis from our award-winning MoneyWeek team, to help you understand what really matters when it comes to your finances.

Four times a week
Look After My Bills
Sign up to our free money-saving newsletter, filled with the latest news and expert advice to help you find the best tips and deals for managing your bills. Start saving today!
Next Monday, I have promised to reveal my Trades for 2015. It is always more than hazardous to one's reputation to make bold predictions for the next 12 months, but that won't stop me.
Most predictions state something like this: "The S&P will reach 3,000 in 2015", or "Gold will touch $1,500 next year".
That may indeed come to pass, but how will they get there? That is the critical question for a trader. It is no good being long the S&P into January only to see it plunge to 1,800 but then recover to hit 3,000 later in the year. You will be slaughtered on that first decline before you can reap any possible rewards.
MoneyWeek
Subscribe to MoneyWeek today and get your first six magazine issues absolutely FREE

Sign up to Money Morning
Don't miss the latest investment and personal finances news, market analysis, plus money-saving tips with our free twice-daily newsletter
Don't miss the latest investment and personal finances news, market analysis, plus money-saving tips with our free twice-daily newsletter
That is why I feel fortunate that the tops in the US stocks indexes seem to have arrived very late in the year in December. That makes my job a little easier.
So tune in on Monday for my Trades for 2015.
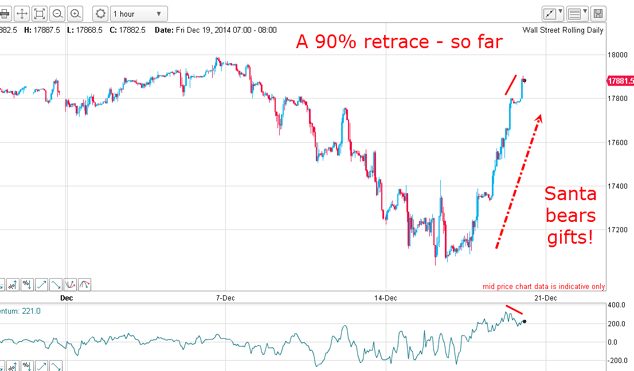
Christmas comes early

The two-day rally has been nothing short of spectacular, which is entirely typical of most of the recoveries that have taken place from significant declines off the major highs since at least 2009.
Many of these upward retracements have been in the 90%-plus bracket and so this current retracement should not come as a total surprise.
In terms of trading strategies, my position has been, since 2009, to identify major tops/highs and to take partial profits near the lows of the declines and to move my protective stop to break even on the remainder.
That way, I bank a superb profit on one part and at worst, break even on the rest. I ensure I take some profit out of my hard work!
And what method do I use to verify the decline has run its course?
Simple chart support can give vital clues

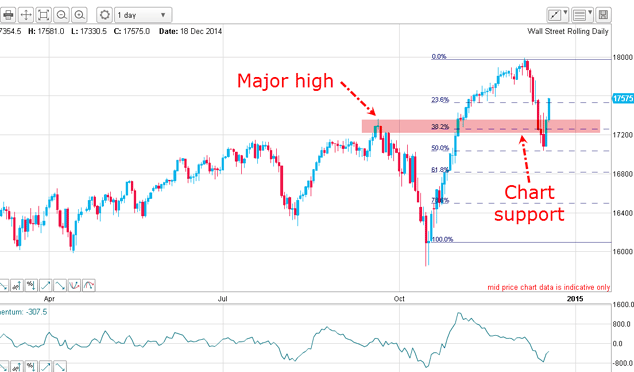
The decline off the early December top was very severe and it ate deeply into the zone of chart support. This is a support zone that centres around a previous high and these zones are well worth noting. That is because usually, the market will respect these support zones and stage a decent bounce.
The general rule is that the deeper the market moves beyond this support zone as here the bigger the subsequent bounce. Think of it as an over-stretched rubber band that snaps back.
So a few days ago, I was on the lookout for such a reversal and hence a place to take profits on my shorts.
Also, the market had fallen to the Fibonacci 50% support level another reason to look for an exit.
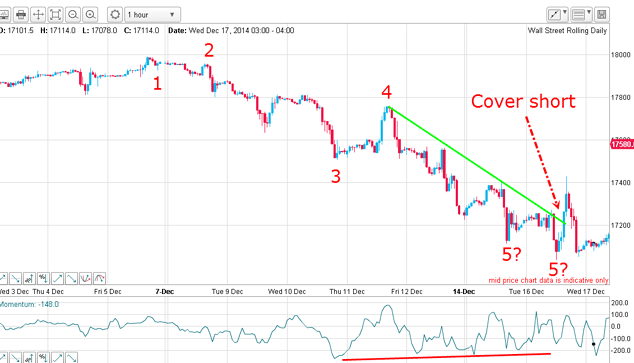
This is the hourly of the decline:

I have a five-wave impulsive decline, and two alternative wave 5s. But the decline off the w4 high has a nice trendline with four accurate touch points. I noted the looming positive momentum divergence and believed the upturn could arrive at any time. It should be sharp and I didn't want to miss my exit.
That is why I moved my take-profit stop to just above the green line and was taken out on Tuesday for a profit of around 600 pips.
So I used basic Elliott wave theoryand simple chart support concepts to give me vital clues about when to take profits. These are the tools I have used all the way up from the 2009 low. I have taken several profits in this way and all in a bull market.
When the all-time top is in and it might be already I will use exactly this same method and take partial profits on a sharp decline, but this time, the remainder position will go on to produce an even bigger win than the first.
Of course, the Santa Rally could carry further, but I am protected from loss on my remainder trade with my break-even stop.
This type of trading is relatively low-stress and I recommend it to you.
Where do we go from here?
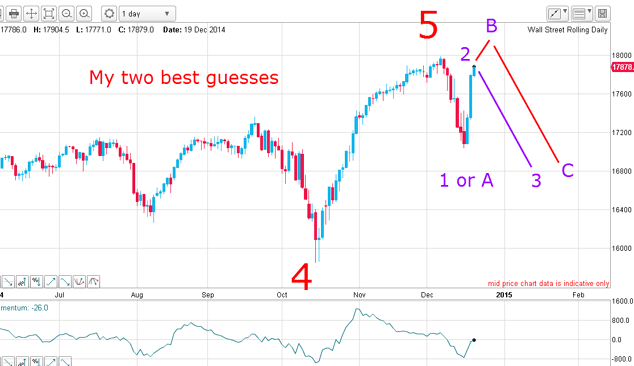
My two best guesses (and one more)
The other is for the market to rally above 18,000 in a B wave and then decline in a long and strong wave C:

There is one other option of course for the market to resume its rally well beyond 18,000. I place that at lower odds because of the weak internals and extreme bullish sentiment of traders and advisors, as well as the precarious debt markets caused by the collapse in oil prices.
So this Santa Rally may well be a classic bull trap.
Get the latest financial news, insights and expert analysis from our award-winning MoneyWeek team, to help you understand what really matters when it comes to your finances.
John is is a British-born lapsed PhD physicist, who previously worked for Nasa on the Mars exploration team. He is a former commodity trading advisor with the US Commodities Futures Trading Commission, and worked in a boutique futures house in California in the 1980s.
He was a partner in one of the first futures newsletter advisory services, based in Washington DC, specialising in pork bellies and currencies. John is primarily a chart-reading trader, having cut his trading teeth in the days before PCs.
As well as his work in the financial world, he has launched, run and sold several 'real' businesses producing 'real' products.
-
 ISA fund and trust picks for every type of investor – which could work for you?
Whether you’re an ISA investor seeking reliable returns, looking to add a bit more risk to your portfolio or are new to investing, MoneyWeek asked the experts for funds and investment trusts you could consider in 2026
-
 The most popular fund sectors of 2025 as investor outflows continue
It was another difficult year for fund inflows but there are signs that investors are returning to the financial markets