Is the Dow really in a big new downtrend?
The Dow has reached a critical juncture and the next move could be dramatic. John C Burford explains what that means for his next trade.
Get the latest financial news, insights and expert analysis from our award-winning MoneyWeek team, to help you understand what really matters when it comes to your finances.
You are now subscribed
Your newsletter sign-up was successful
Want to add more newsletters?

Twice daily
MoneyWeek
Get the latest financial news, insights and expert analysis from our award-winning MoneyWeek team, to help you understand what really matters when it comes to your finances.

Four times a week
Look After My Bills
Sign up to our free money-saving newsletter, filled with the latest news and expert advice to help you find the best tips and deals for managing your bills. Start saving today!
In Wednesday's post, I posed the question: Has the Dow finally turned?
I laid out what I believe was a strong case to say that it likely has. But since then, some doubt has crept into the picture.
My main piece of evidence for a turn is this chart shown Wednesday:
MoneyWeek
Subscribe to MoneyWeek today and get your first six magazine issues absolutely FREE

Sign up to Money Morning
Don't miss the latest investment and personal finances news, market analysis, plus money-saving tips with our free twice-daily newsletter
Don't miss the latest investment and personal finances news, market analysis, plus money-saving tips with our free twice-daily newsletter
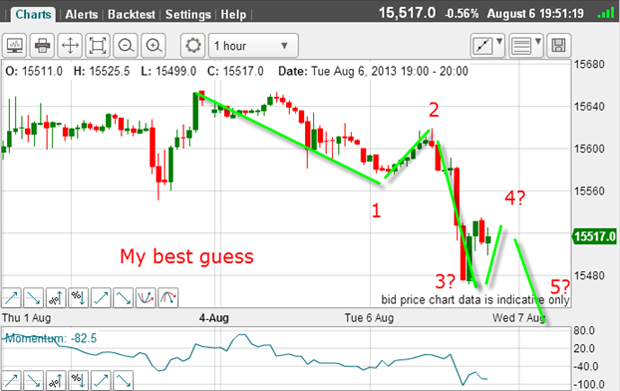
I have a five-wave move down shown by the green bars with a strong wave 3. And within wave 1, there is a clear five-wave pattern.
So did my best guess turn out well?
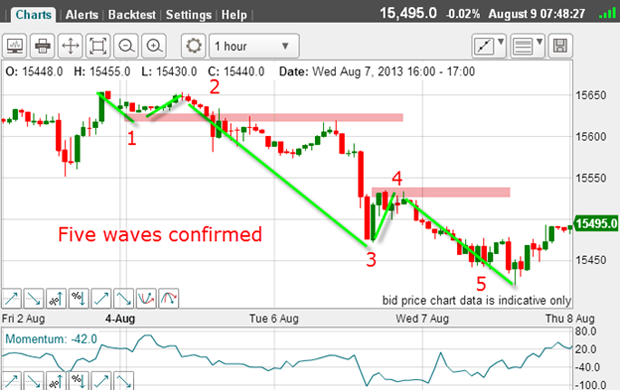
In fact, it was perfect! And that increased my confidence level that after this five wave sequence, I should expect a relief rally preferably in an A-B-C form before turning back down.
But in terms of trading, excellent short entries were indicated by the two pink bars. The top one lies just underneath the minor low of wave 1.
This is a favourite strategy of mine placing sell-stops just under a minor low in anticipation of a swift move down. Your protective stop would be just above the wave 2 high, thus providing a low-risk trade with high probability of success.
The lower entry was on the wave 4 high in anticipation of the final move down in wave 5. The short-term profit avaiable here was 50-100 pips, which is a decent swing trade taking less than 24 hours.
OK, so I have my five down and the next move should be up but how high can I expect it to carry?
This is where the Fibonacci levels come into their own.
Use Fibonacci to spot the short trades
This is what occurred yesterday:
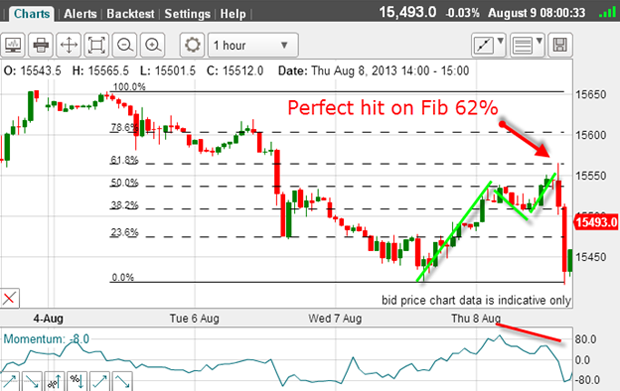
I had my prefect hit (on a spike) on the Fibonacci 62% level and after putting in a clear A-B-C (green bars) and a large negative-momentum divergence (red bar).
This is starting to look textbook! And the market looked poised to move lower.
And that 62% level was another perfect place to enter a short trade.
Even at the 50% level, a trade could have been put on, giving it a little room on your stop to allow for a possible move to the higher 62% level.
All I needed now was a swift move back down to beneath the previous low and following the end of the C wave top, that move got underway.
This was getting exciting! And was confirming perfectly my bearish stance and was helping identify Monday's 15,650 level as the top.
Then the surprise
That was not in the script!
Here is the current chart:
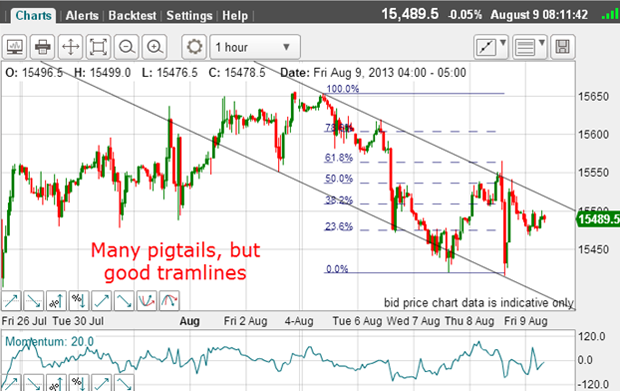
And now I can draw tramlines. They are not perfect, as I have to deal with many pigtails and one overshoot.
I like the lower one as it has several good touch points. This means that I have more confidence in the upper line.
So a break of this upper line could mean that I may have to change my bearish view at least put it on hold until I get more confirmation.
At times like these, when the picture in the Dow is cloudy, I like to see what other stock indexes are looking like.
Here is the Nasdaq:
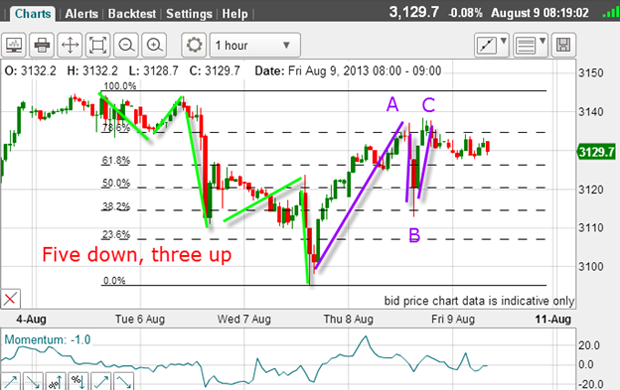
The Nasdaq is an index containing the more speculative US shares, while the Dow is the index with 30 of the biggest companies in the US, and is considered a much less risky market than the Nasdaq.
Here, I have a clear five down and an A-B-C up with the C wave topping at the Fibonacci 76% retrace (compare with the Dow's retrace to the 62% level).
So this picture seems to confirm my bearish view, does it not?
But taking a closer look at the Nasdaq chart again, there are alternative labels I can apply:
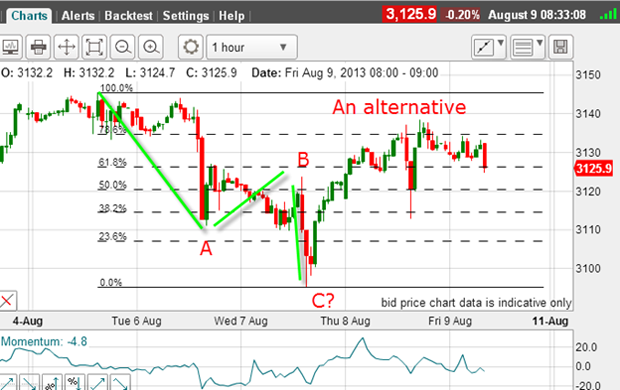
The move down can be seen as an A-B-C with a slight positive-momentum divergence at the C wave low.
Now, how can I tell which picture will prevail?
If the Dow and/or the Nasdaq rallies to new highs that would definitely cancel out the immediately bearish scenario.
But if the market declines from here to make new lows for the move, that would indicate we are in third waves down and as we know, they can be long and strong.
So my lines in the sand are the 15,650 level in the Dow on the upside, and the support at 15,400 level on the downside.
Here is the Dow chart to show how critical the 15,400 level really is:
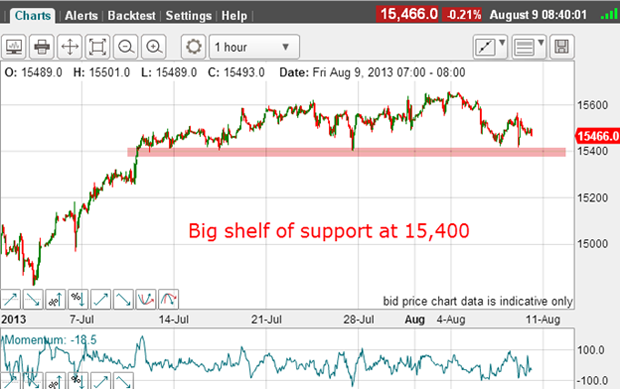
Since mid-July, the market has respected this level as major support note all of the touch points where every time the market has tested it, it has held.
But lines of support eventually do give way and when this one is defeated, the move should be historic, since the line will then become a huge shelf of resistance.
Get the latest financial news, insights and expert analysis from our award-winning MoneyWeek team, to help you understand what really matters when it comes to your finances.
John is is a British-born lapsed PhD physicist, who previously worked for Nasa on the Mars exploration team. He is a former commodity trading advisor with the US Commodities Futures Trading Commission, and worked in a boutique futures house in California in the 1980s.
He was a partner in one of the first futures newsletter advisory services, based in Washington DC, specialising in pork bellies and currencies. John is primarily a chart-reading trader, having cut his trading teeth in the days before PCs.
As well as his work in the financial world, he has launched, run and sold several 'real' businesses producing 'real' products.
-
 MoneyWeek Talks: The funds to choose in 2026
Podcast Fidelity's Tom Stevenson reveals his top three funds for 2026 for your ISA or self-invested personal pension
-
 Three companies with deep economic moats to buy now
Opinion An economic moat can underpin a company's future returns. Here, Imran Sattar, portfolio manager at Edinburgh Investment Trust, selects three stocks to buy now