Is the gold market setting up for a big rally?
The gold market is listing heavily to the bearish side. Here, John C Burford explains how swing traders can use the charts to profit.
Get the latest financial news, insights and expert analysis from our award-winning MoneyWeek team, to help you understand what really matters when it comes to your finances.
You are now subscribed
Your newsletter sign-up was successful
Want to add more newsletters?

Twice daily
MoneyWeek
Get the latest financial news, insights and expert analysis from our award-winning MoneyWeek team, to help you understand what really matters when it comes to your finances.

Four times a week
Look After My Bills
Sign up to our free money-saving newsletter, filled with the latest news and expert advice to help you find the best tips and deals for managing your bills. Start saving today!
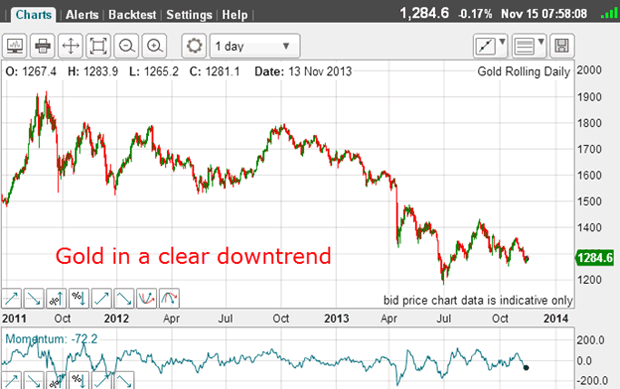
The gold market has been getting a very bad press lately. It seems that the bulls have decided that their dreams of $2,000, or $2,500, or $5,000 gold must be abandoned.
You might recall that this was the common belief pre-2011.
Now, pundits are falling over themselves projecting lower and lower prices, which is a complete reversal of that bullish scenario.
MoneyWeek
Subscribe to MoneyWeek today and get your first six magazine issues absolutely FREE

Sign up to Money Morning
Don't miss the latest investment and personal finances news, market analysis, plus money-saving tips with our free twice-daily newsletter
Don't miss the latest investment and personal finances news, market analysis, plus money-saving tips with our free twice-daily newsletter
In September, Goldman Sachs famously hit the headlines with this projection:
"While we agree with the mid-cycle price somewhat around $1,200, we believe that at least near-term it can overshoot to the downside, which is why we have $1,050 as a target. It clearly could trade below $1,000."
When I see such a widely-publicised forecast from a leading trader with specific targets and they are a long distance from the current market I sit up and pay attention.
Here is the daily chart:

Where small traders should focus
The problem is that if trading short, you must be prepared to sit through painful counter-trend rallies. Not many small traders are able to do this. It is only the large traders, such as hedge funds, that are able to weather these storms.
Why is this? Simply because we are trading on margin with a relatively small account. And an adverse move of a few percent in the market could wipe us out. Also, not many of us are psychologically prepared for a large setback to our account balance.
It would take a very stoic trader to do this. And although this is an admirable trait in many areas of life, in trading it can lead to a certain stubbornness to accept losses. This approach would break one of the main tenets of trading cut losses short and let profits run.
These are reasons why small traders should focus on swing trading, where we try to catch the short to medium term swings.
Signs of a major bottom
Also, blog comments on gold have gone very quiet as the bear market has progressed. Most of the gold bugs have gone into hibernation. This is another sign that we could be seeing a major bottom soon.
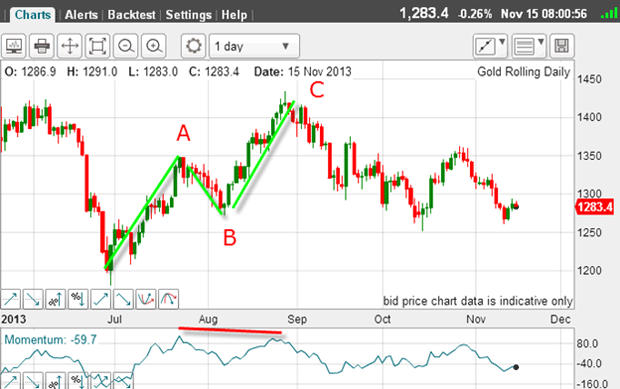
So let's zoom in on the shorter-term chart:

From the plunge low to $1,180 in late June, the market rallied a large A-B-C, and in Elliott wave theory, an A-B-C is counter-trend. This pattern confirmed the downtrend was intact.
This Elliott wave rule is one of the most useful for a swing trader. If you can spot a three-wave A-B-C pattern appearing in a defined trend, then you can have confidence that when the C wave completes, the main trend is very likely to resume.
This would offer a low-risk trade since stops can be close.
And there is no shortage of A-B-Cs in the markets!
Will there be a rally?
But is it in a position to stage a decent $50 - $100 rally? That is the kind of move swing traders love!
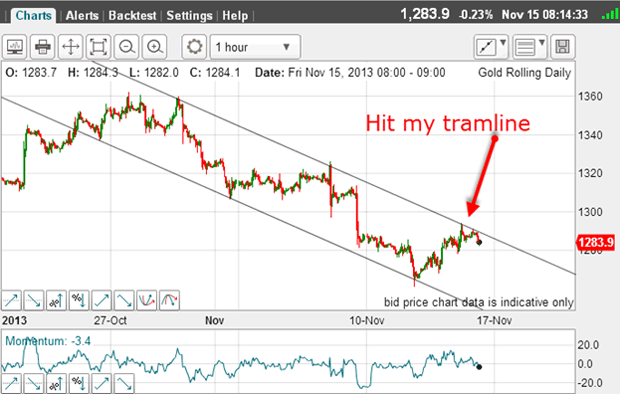
Let's zoom in even closer:

I have drawn in my tramlines from the late October rally high. The market has hit my upper line in the last 24 hours and is currently bouncing off it as the resistance of the line kicks in.
Now, what is the outlook this morning?

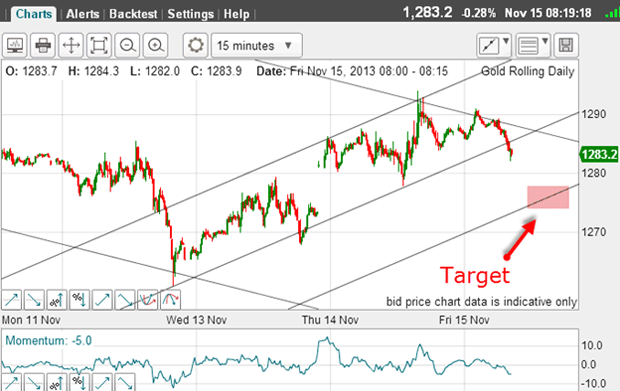
Here is the 15-minute chart with new tramlines drawn on the rally. They are not ideal because they have several pigtails. But this is typical for the spiky gold market.
The centre tramline has just been broken and if it is a genuine break we must always be on guard for head fakes then my downside target is the pink zone on the lower tramline.
That move would close the wide gap formed late Wednesday. Remember, gaps of this kind normally do get filled before moving higher.
If the market does move down to my lower tramline, then that would set up the possibility of a good bounce. By then, the bullish contingent should be even smaller than 10% - and the market could be sold out.
At this stage, the long-term down-sloping tramline still offers strong resistance, but if the market could break above that line, a sharp rally could be expected.
Why? Simply because there should be many protective buy-stops resting above this line that have been placed there by the large army of bears. Remember, 90% of traders are bears!
So these are the competing forces at work in gold as I see them this morning.
One very telling factor is the activities of the world's central banks. They own around 20% of the known global gold stockpile and are major players.
Since the 2011 high, many have been buying in size, but according to reports, have lost around $500bn on their holdings. That's the kind of loss I wouldn't like to take!
In fact, central banks are notorious for being very poor traders (that is not their function, I admit). But when the banks are buying, give it to them!
Get the latest financial news, insights and expert analysis from our award-winning MoneyWeek team, to help you understand what really matters when it comes to your finances.
John is is a British-born lapsed PhD physicist, who previously worked for Nasa on the Mars exploration team. He is a former commodity trading advisor with the US Commodities Futures Trading Commission, and worked in a boutique futures house in California in the 1980s.
He was a partner in one of the first futures newsletter advisory services, based in Washington DC, specialising in pork bellies and currencies. John is primarily a chart-reading trader, having cut his trading teeth in the days before PCs.
As well as his work in the financial world, he has launched, run and sold several 'real' businesses producing 'real' products.
-
 ISA fund and trust picks for every type of investor – which could work for you?
Whether you’re an ISA investor seeking reliable returns, looking to add a bit more risk to your portfolio or are new to investing, MoneyWeek asked the experts for funds and investment trusts you could consider in 2026
-
 The most popular fund sectors of 2025 as investor outflows continue
It was another difficult year for fund inflows but there are signs that investors are returning to the financial markets